Akiya (Vacant) Properties Japan Market Analysis
State of Abandoned Properties in Japan
Report Date: May 23, 2025
Executive Summary
This comprehensive analysis examines the current state of Akiya (abandoned house) properties across Japan, utilizing data visualization and statistical analysis of 7,644 properties across 571 cities in 46 prefectures. The findings reveal significant insights into Japan's rural depopulation challenges and emerging opportunities in the housing market, with properties averaging ¥6.04 million ($42,067 USD) but ranging from as low as ¥1 ($0.01 USD) to ¥410 million ($2.85 million USD).
1. Market Overview & Property Distribution
Scale and Geographic Coverage
- Total Properties Analyzed: 7,644 Akiya properties
- Geographic Coverage: 571 unique cities across 46 prefectures
- Data Completeness: 6,806 properties (89%) have complete pricing information
Geographic Distribution
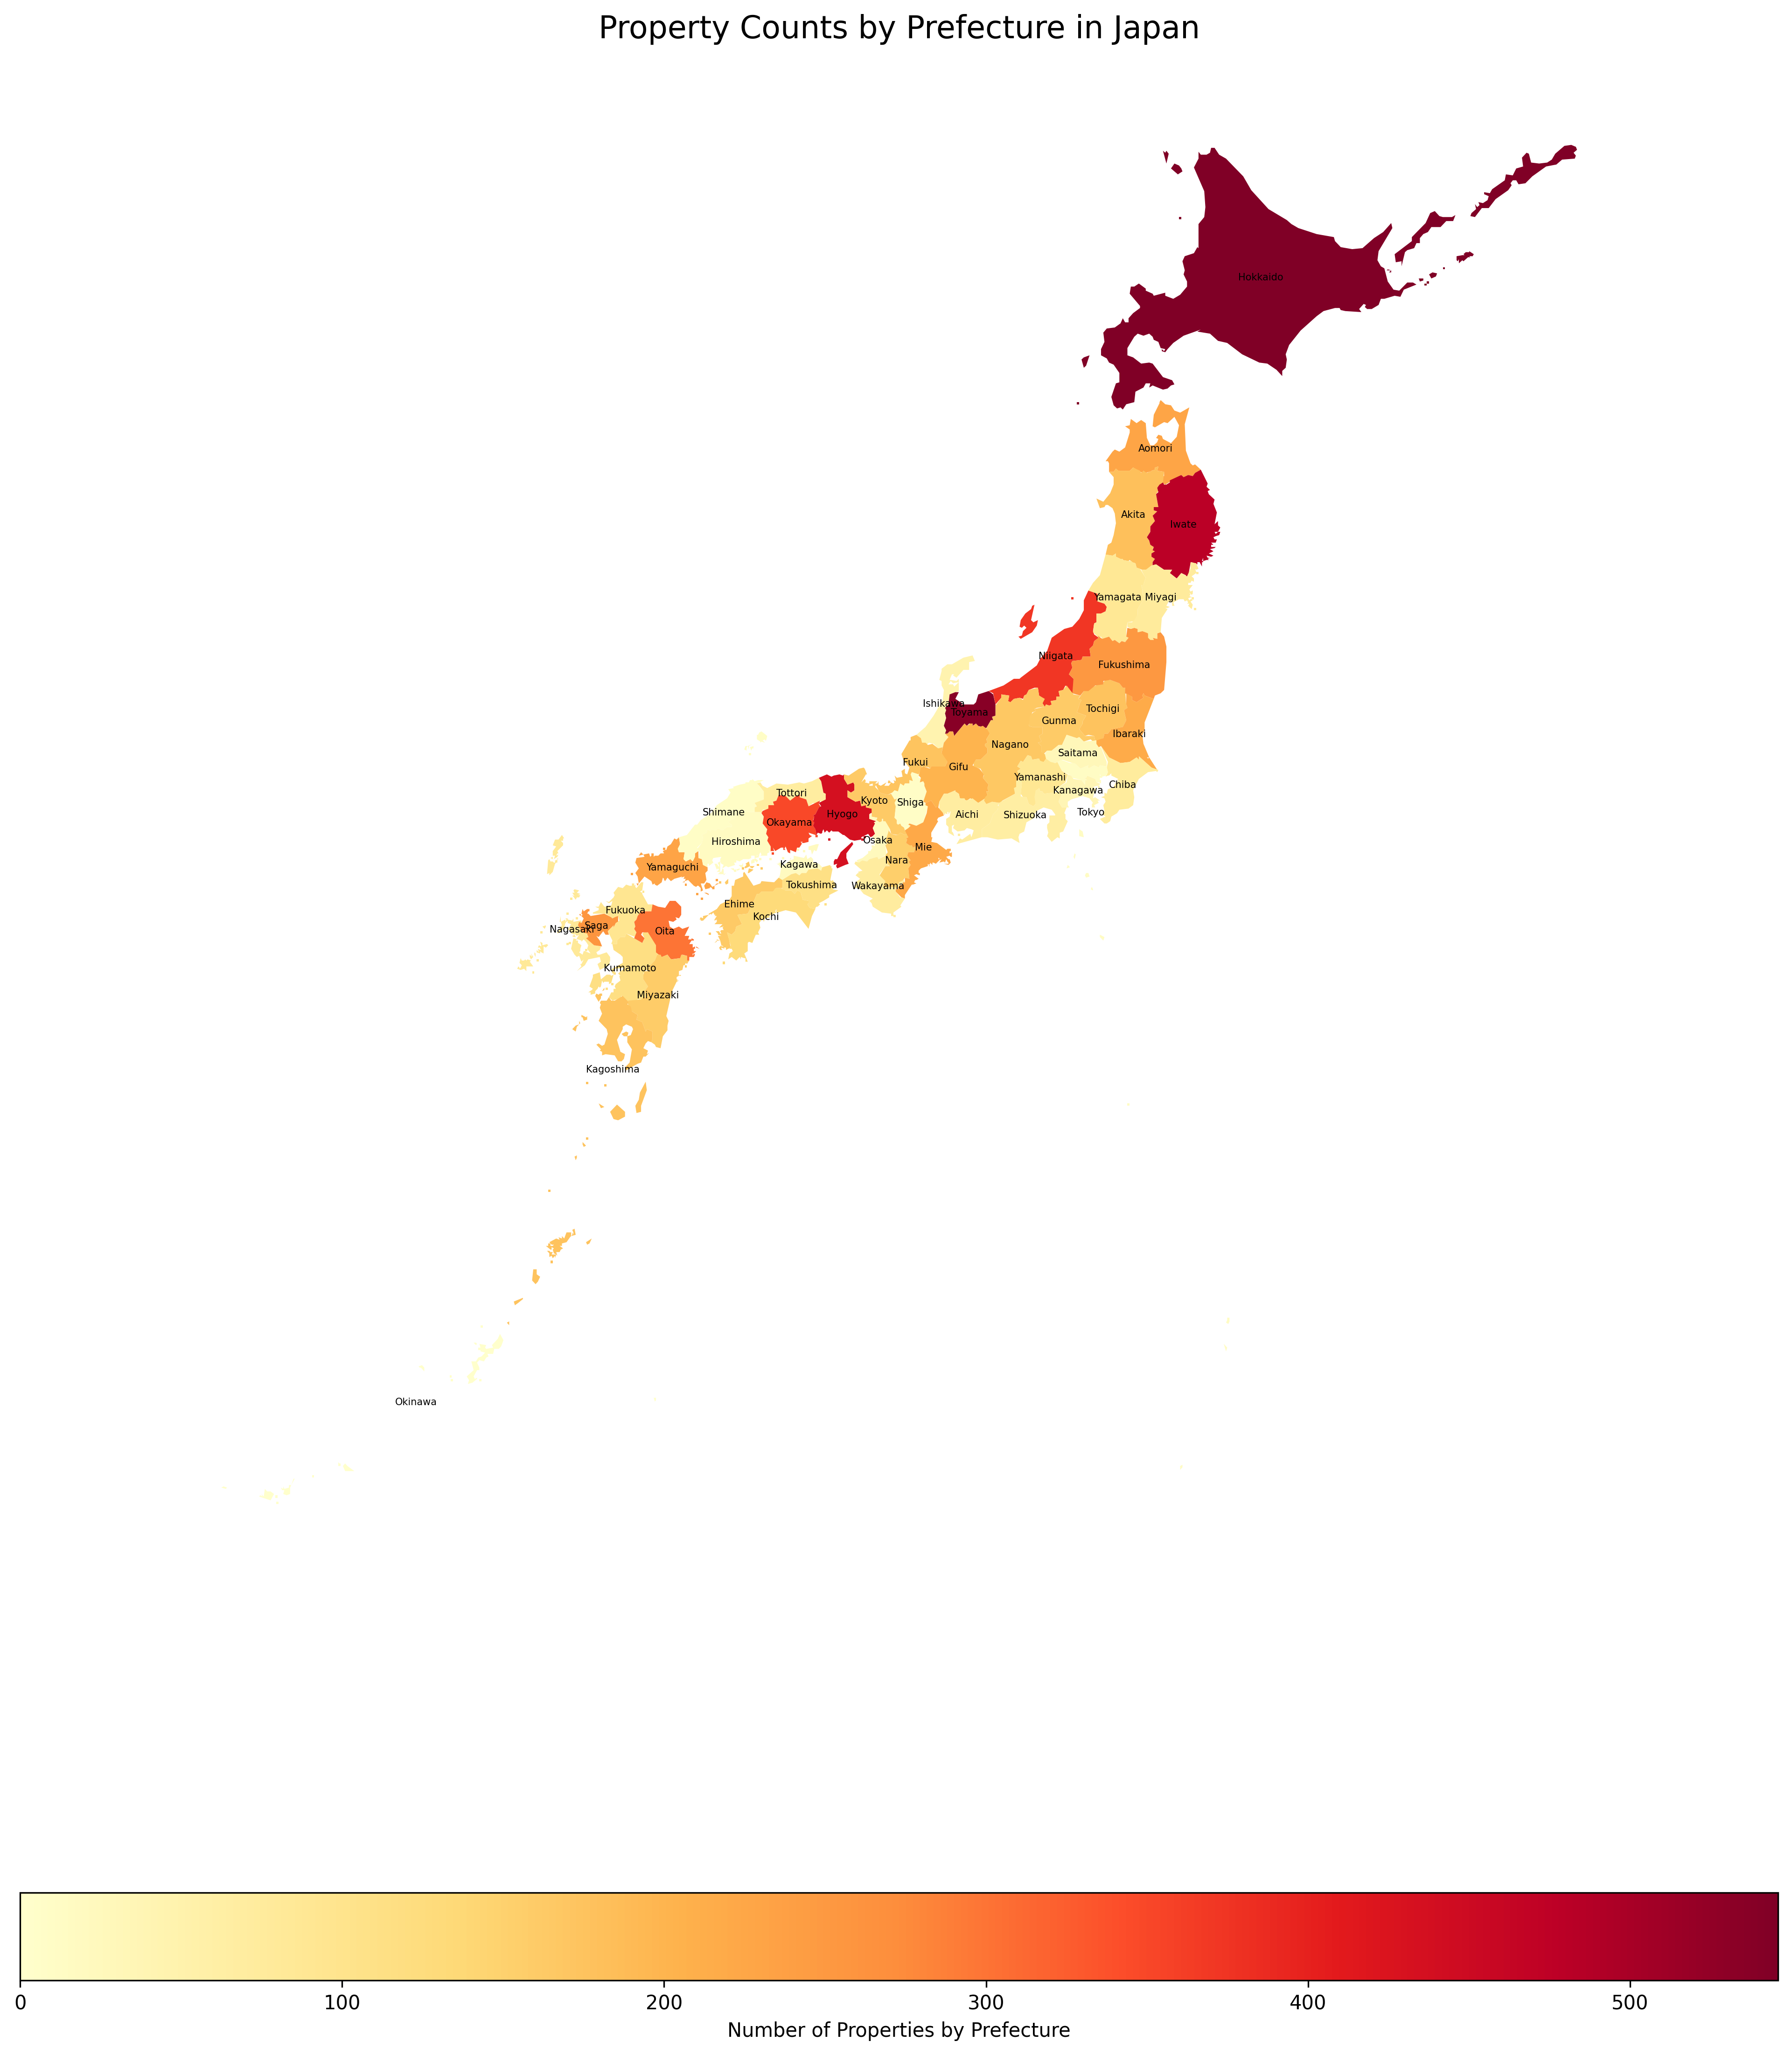
The prefecture-level analysis reveals a highly uneven distribution of Akiya properties across Japan. The top 10 prefectures account for 3,762 properties (49.2%) of the total market:
| Prefecture | Property Count | Percentage |
|---|---|---|
| Hokkaido | 546 | 7.1% |
| Toyama | 537 | 7.0% |
| Iwate | 478 | 6.3% |
| Hyogo | 436 | 5.7% |
| Niigata | 373 | 4.9% |
| Okayama | 349 | 4.6% |
| Oita | 299 | 3.9% |
| Saga | 259 | 3.4% |
| Fukushima | 253 | 3.3% |
| Yamaguchi | 232 | 3.0% |
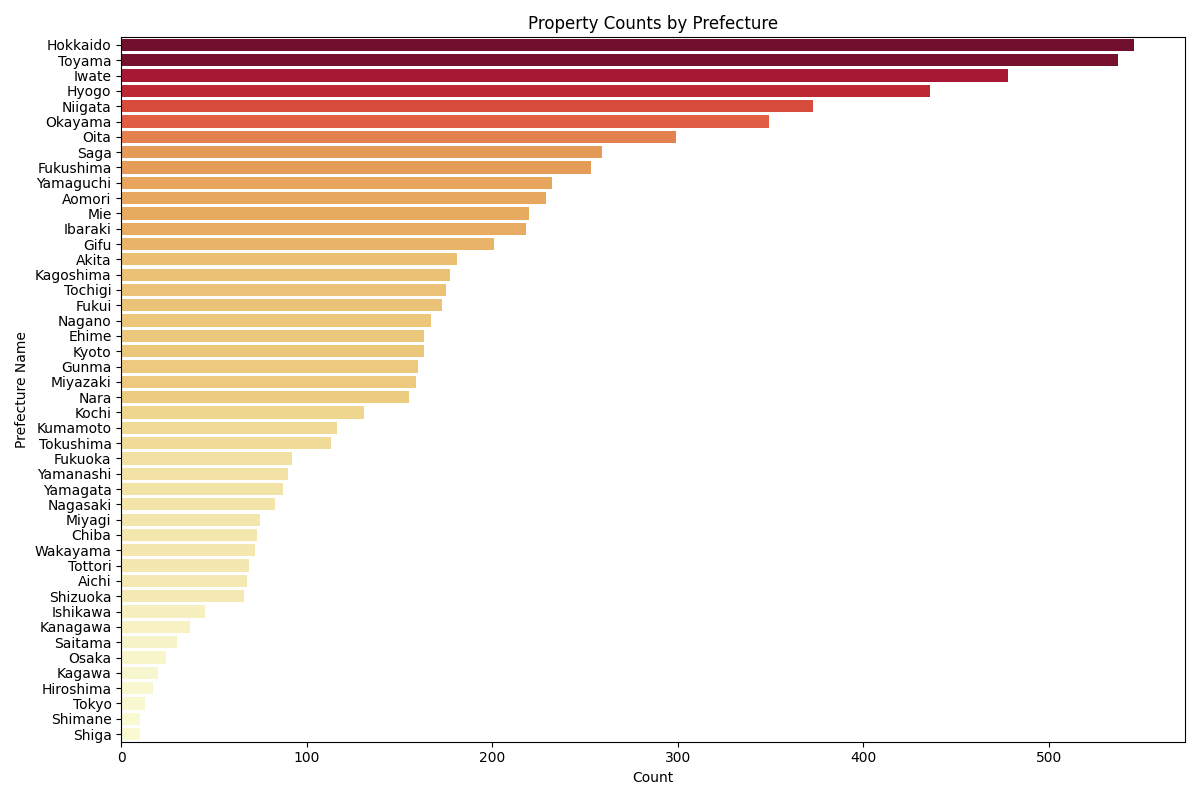
Rural prefectures, particularly in northern and mountainous regions and areas experiencing population decline, show the highest concentrations of abandoned properties. This distribution directly correlates with Japan's ongoing urbanization trends and demographic shifts.
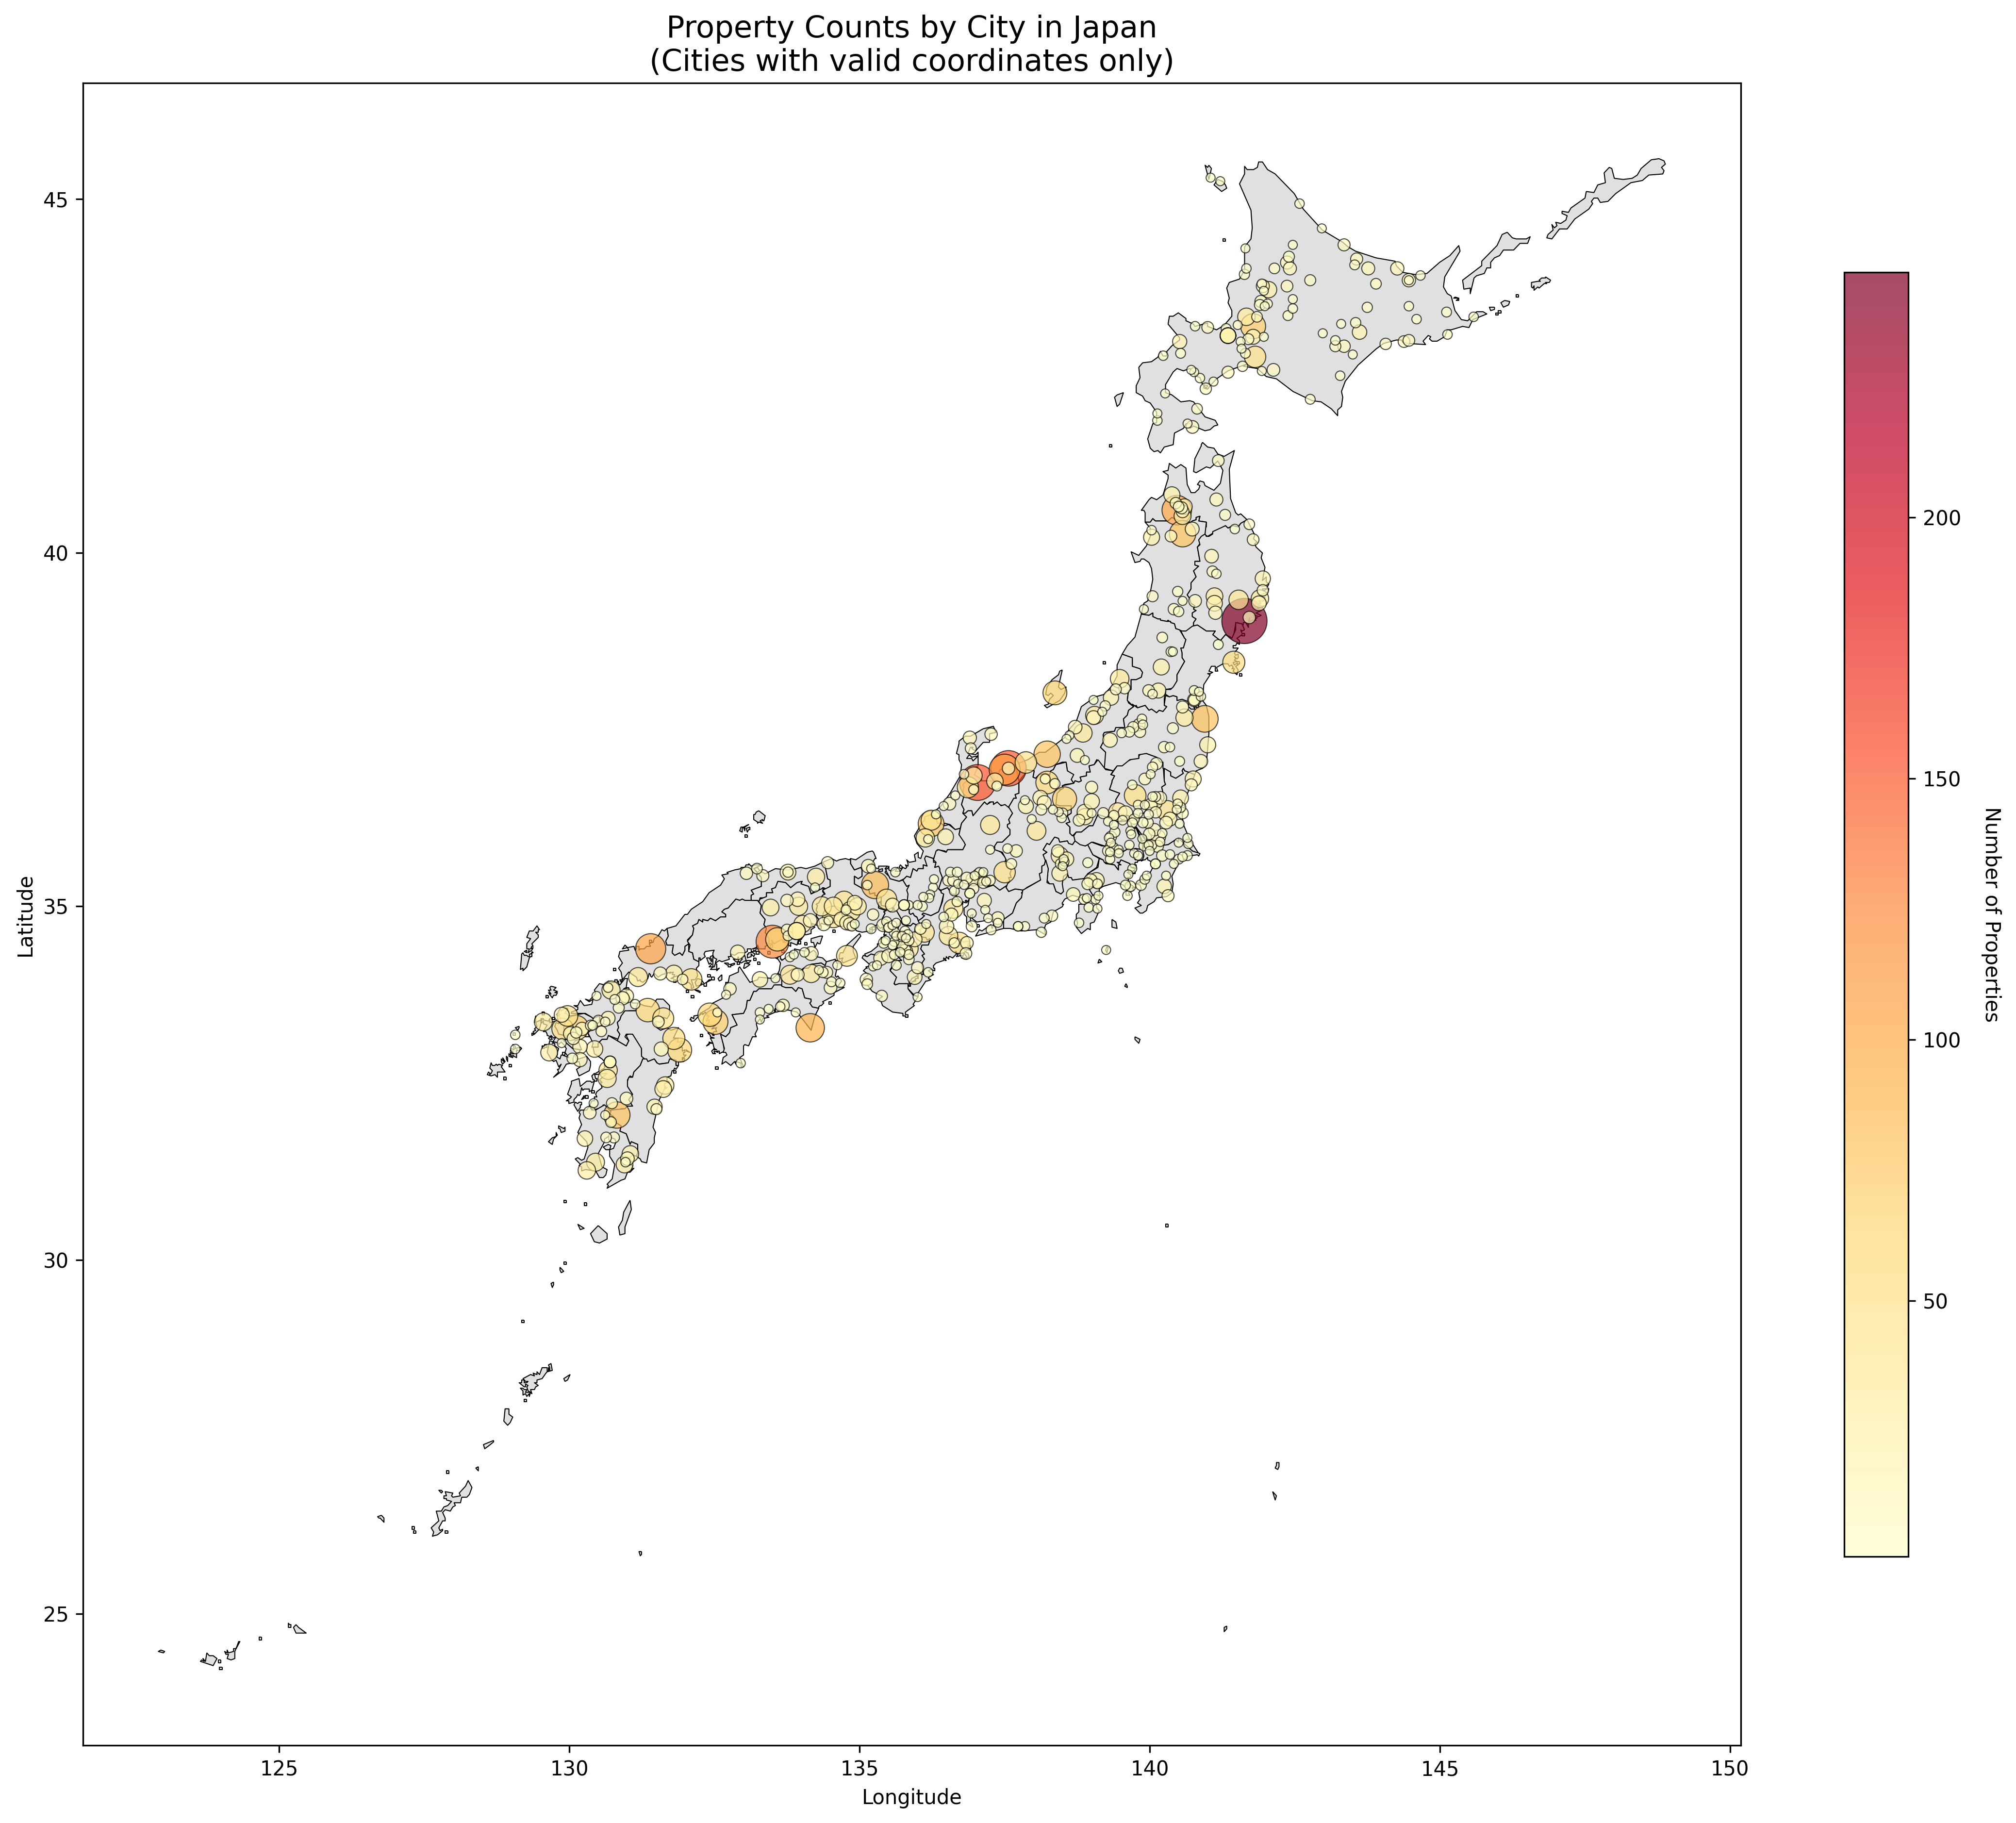
City-Level Insights
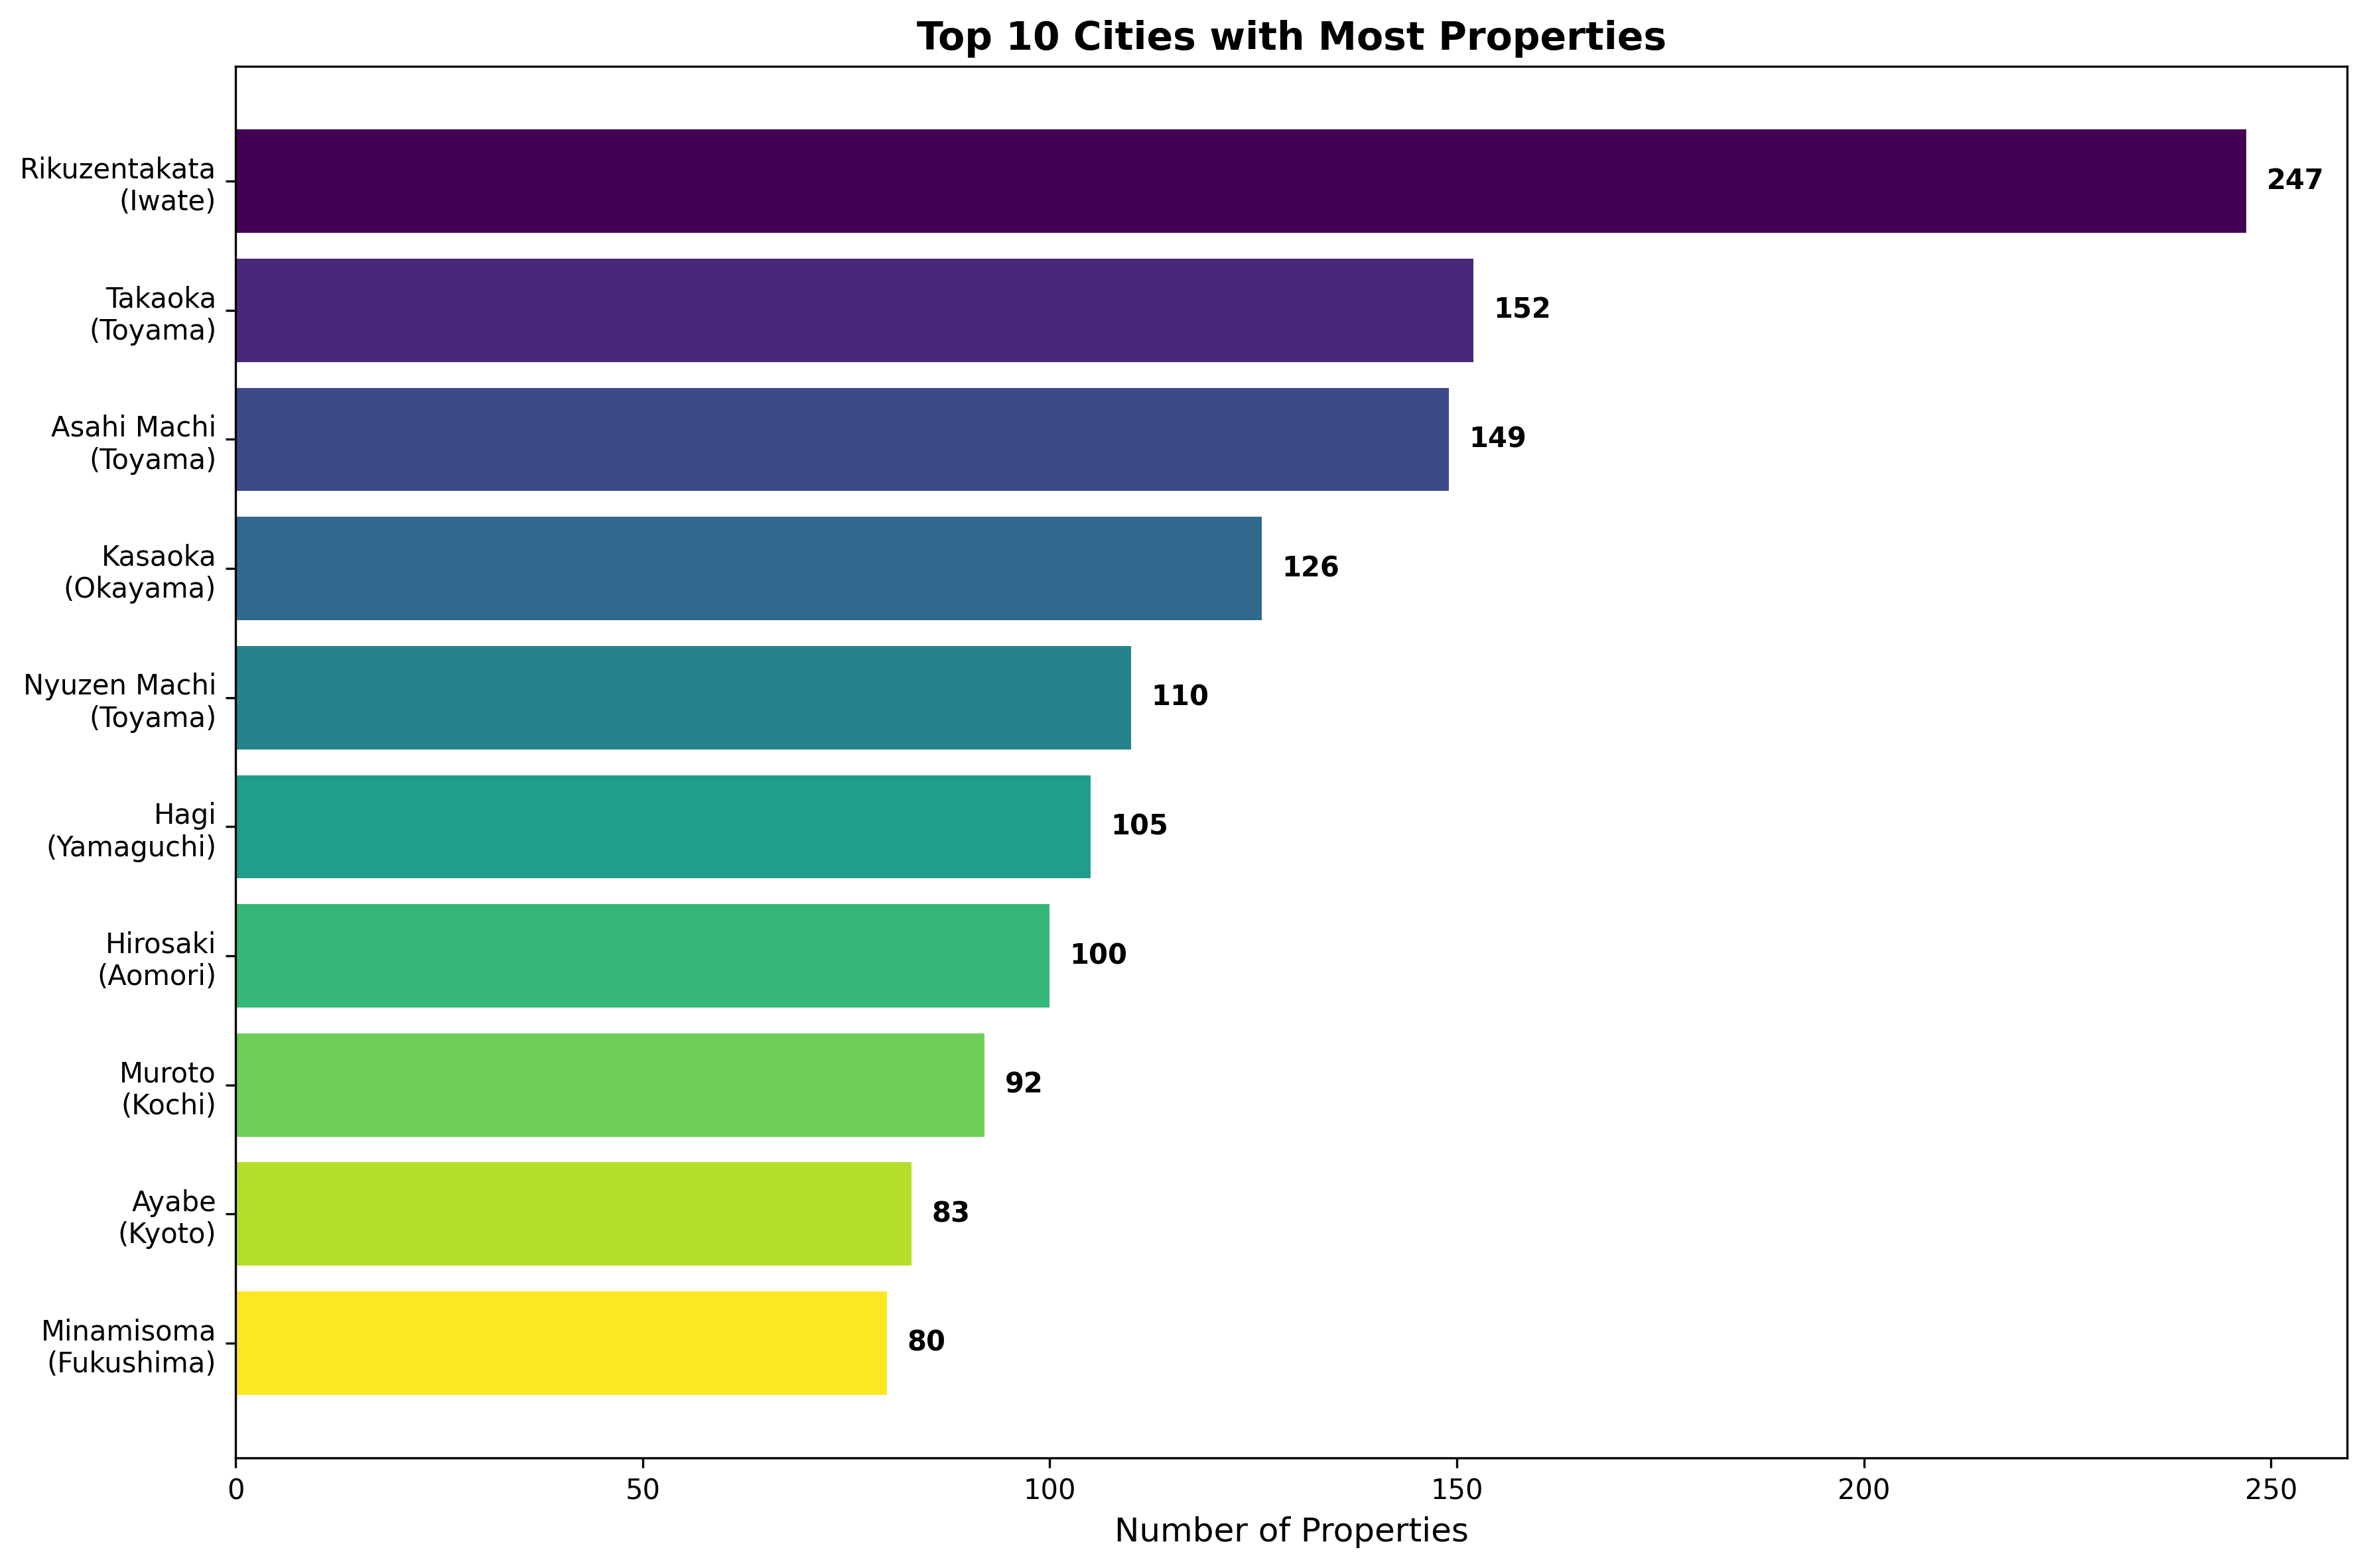
Top 10 Cities by Property Count:
| Rank | City (Prefecture) | Property Count | % of Total Market |
|---|---|---|---|
| 1 | Rikuzentakata (Iwate) | 247 | 3.2% |
| 2 | Takaoka (Toyama) | 152 | 2.0% |
| 3 | Asahi Machi (Toyama) | 149 | 1.9% |
| 4 | Kasaoka (Okayama) | 126 | 1.6% |
| 5 | Nyuzen Machi (Toyama) | 110 | 1.4% |
| 6 | Hagi (Yamaguchi) | 105 | 1.4% |
| 7 | Hirosaki (Aomori) | 100 | 1.3% |
| 8 | Muroto (Kochi) | 92 | 1.2% |
| 9 | Ayabe (Kyoto) | 83 | 1.1% |
| 10 | Minamisoma (Fukushima) | 80 | 1.0% |
These cities often represent former industrial towns experiencing economic decline, rural communities with aging populations, and areas affected by natural disasters such as the 2011 tsunami (notably Rikuzentakata and Minamisoma).
2. Pricing Analysis
Overall Market Statistics
Key Pricing Metrics:
| Metric | Value |
|---|---|
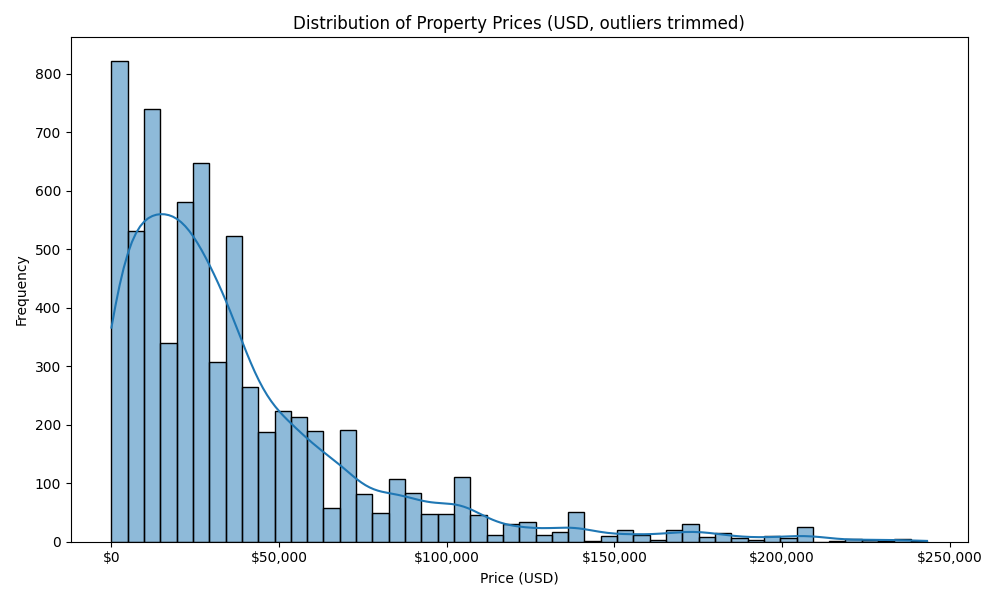
| Average Price | ¥6,044,080 ($42,067 USD) |
| Median Price | ¥3,900,000 ($27,144 USD) |
| Price Range | ¥1 ($0.01) to ¥410,000,000 ($2,853,600) |
| Properties with Pricing | 6,806 out of 7,644 (89.0%) |
| Missing Price Data | 838 properties (11.0%) |
The significant difference between average and median prices (¥2.14 million gap) indicates a right-skewed distribution with some high-value outliers pulling the average upward.
Geographic Price Variations
City-Level Price Analysis (428 cities with pricing data):
| Metric | Value |
|---|---|
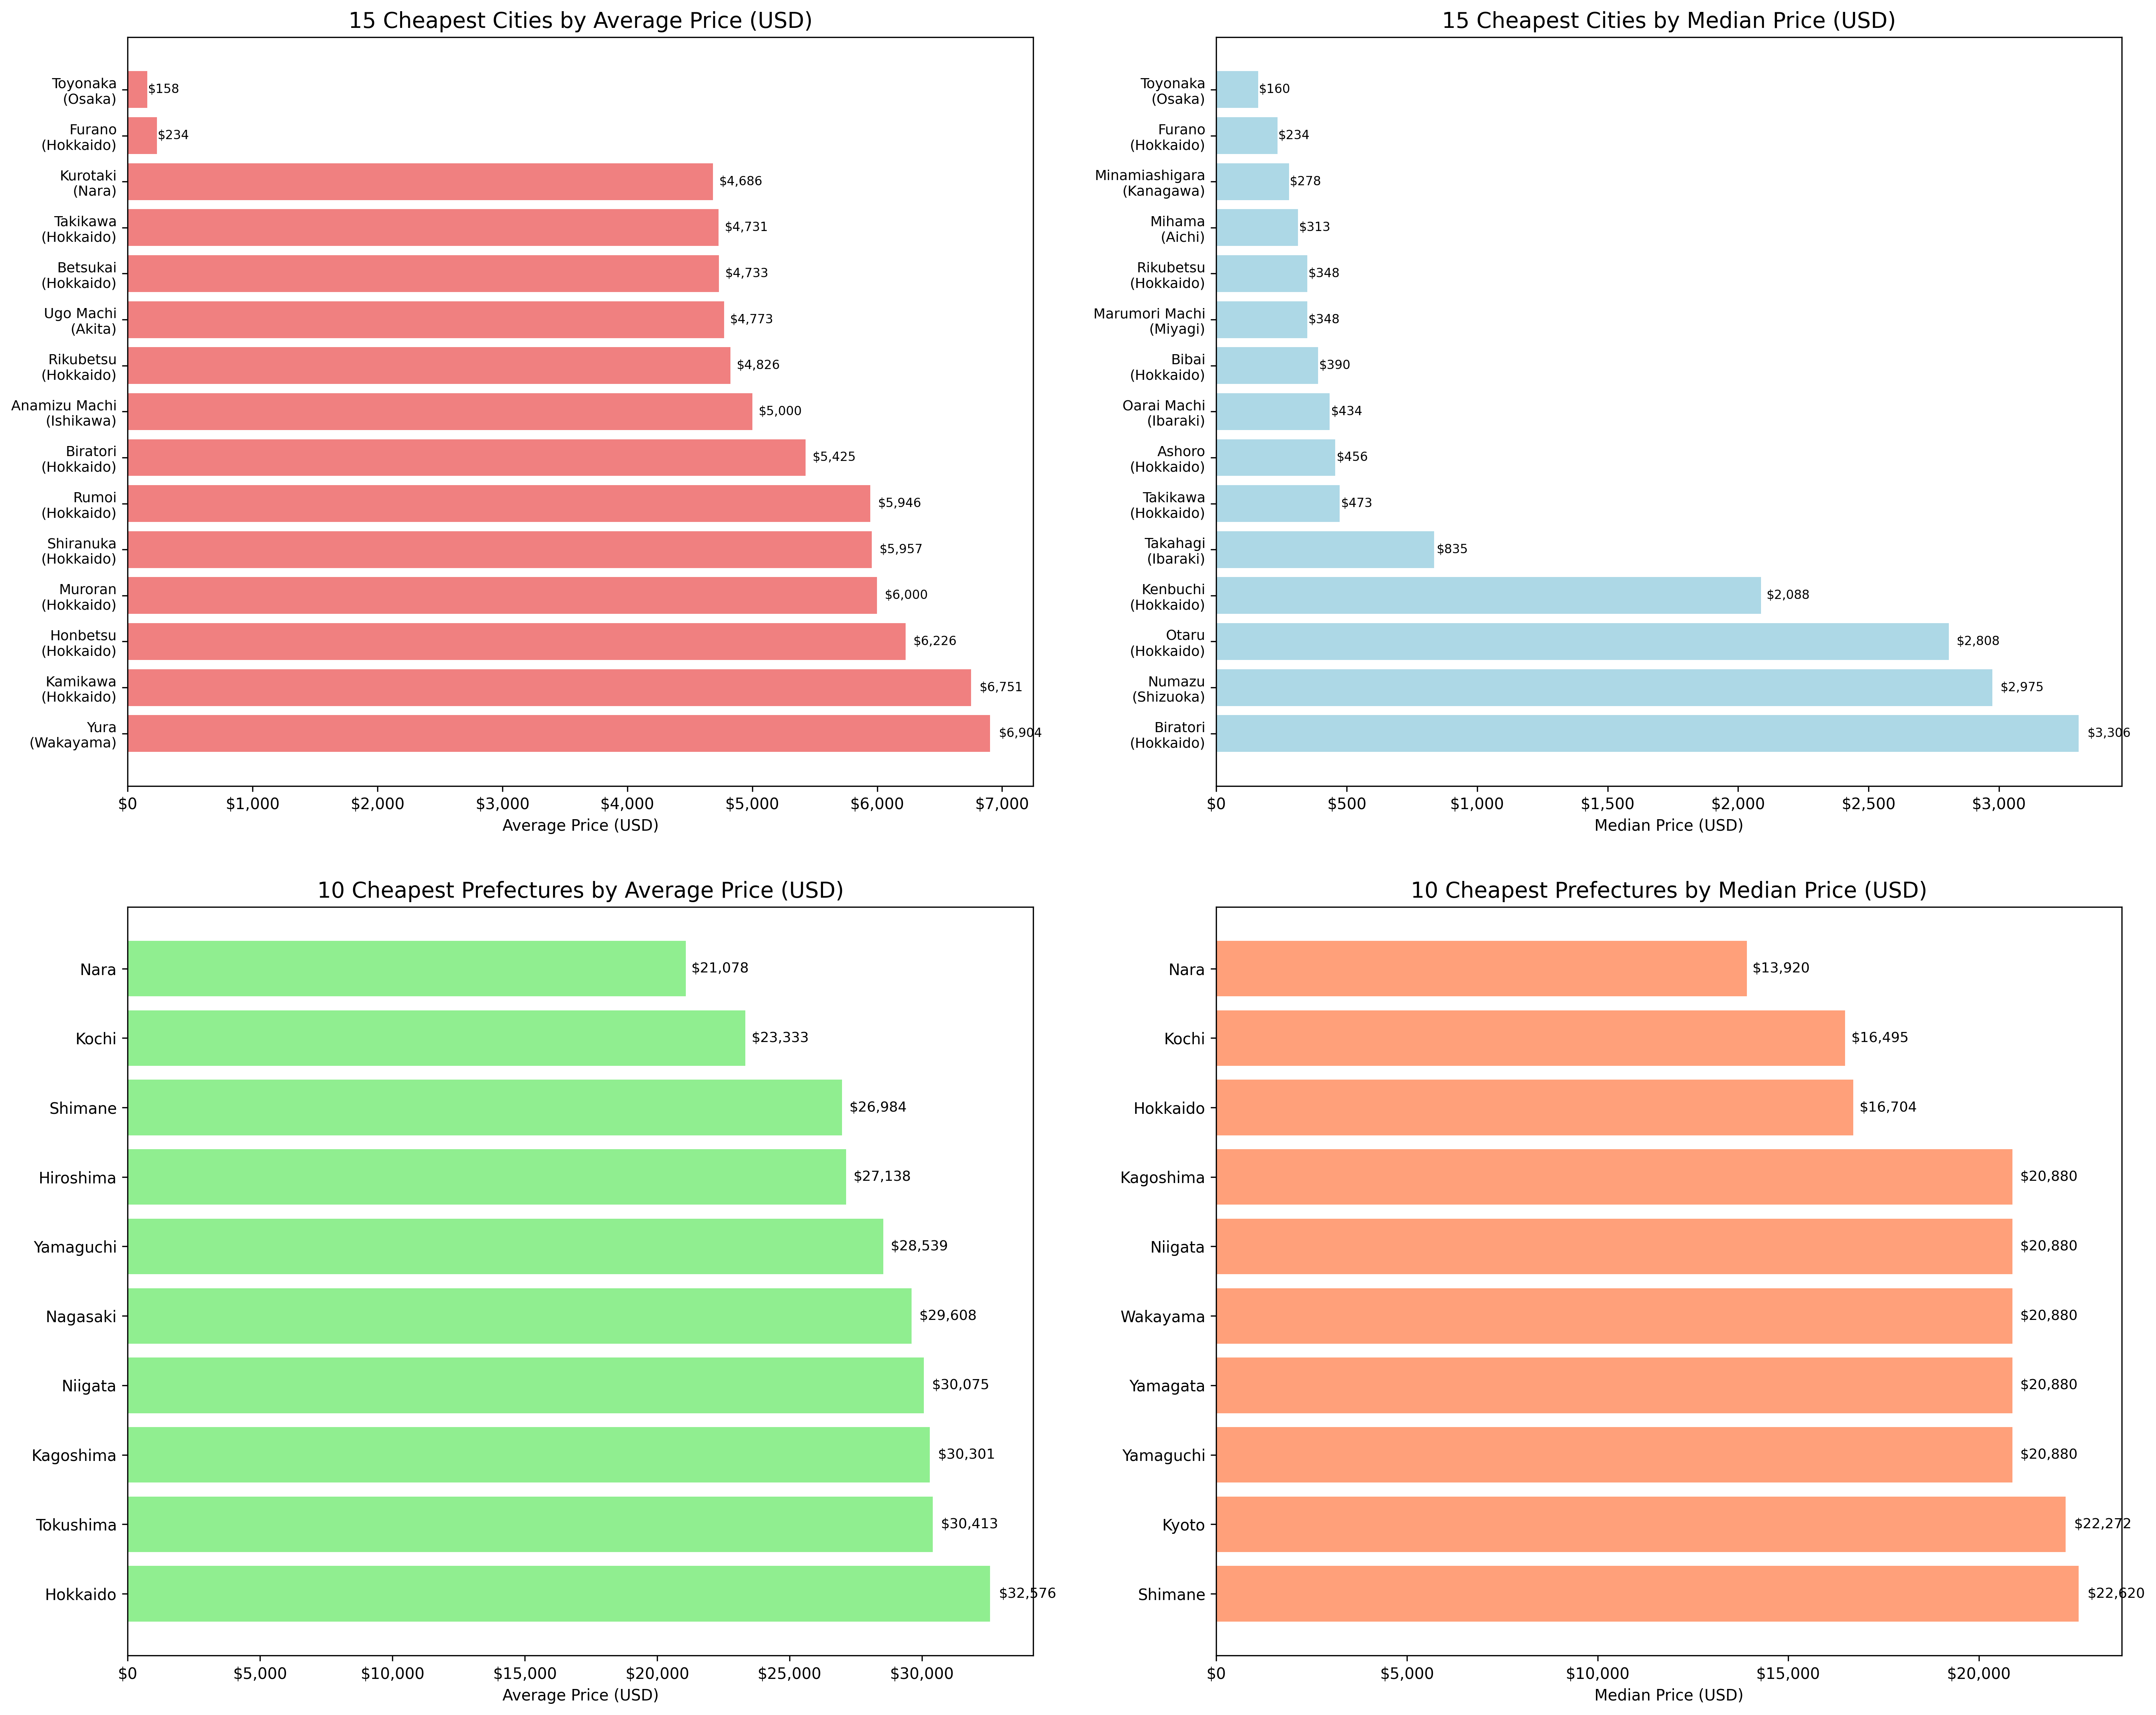
| Cheapest City Average | $158 (Toyonaka, Osaka) |
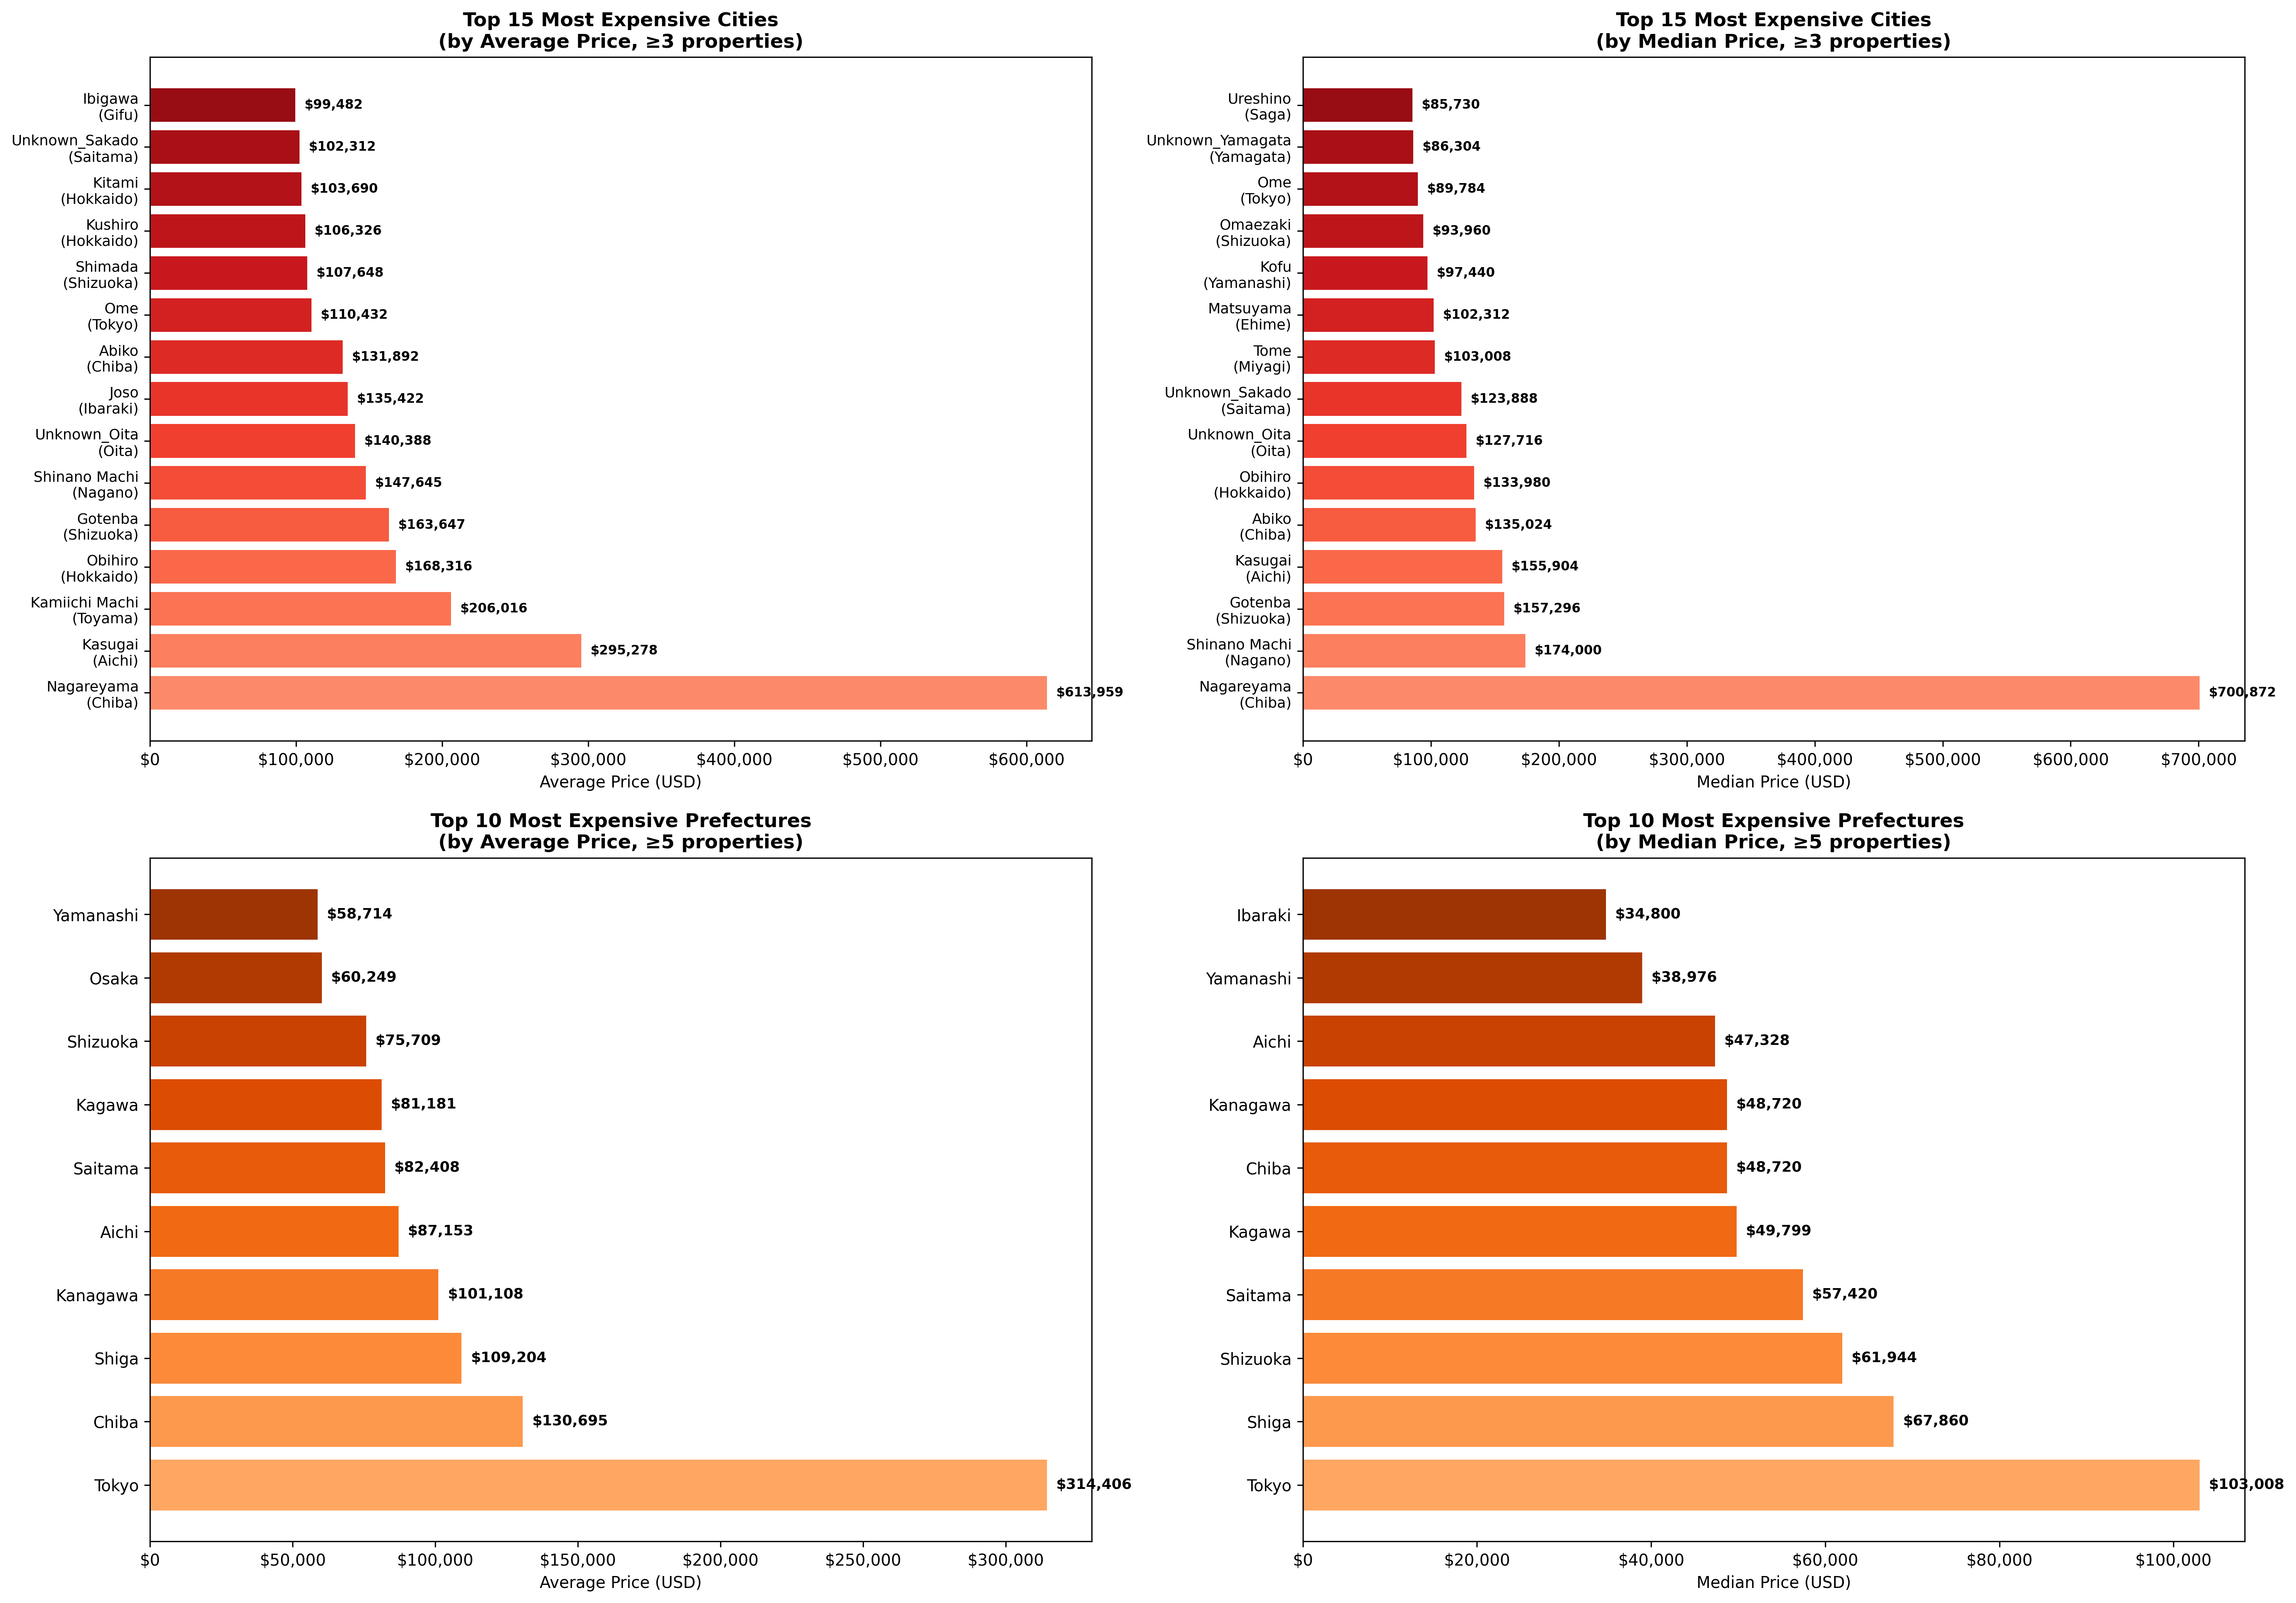
| Most Expensive City Average | $700,872 |
| City Average Price | $35,871 |
| Price Range Factor | 4,448x difference between cheapest and most expensive |
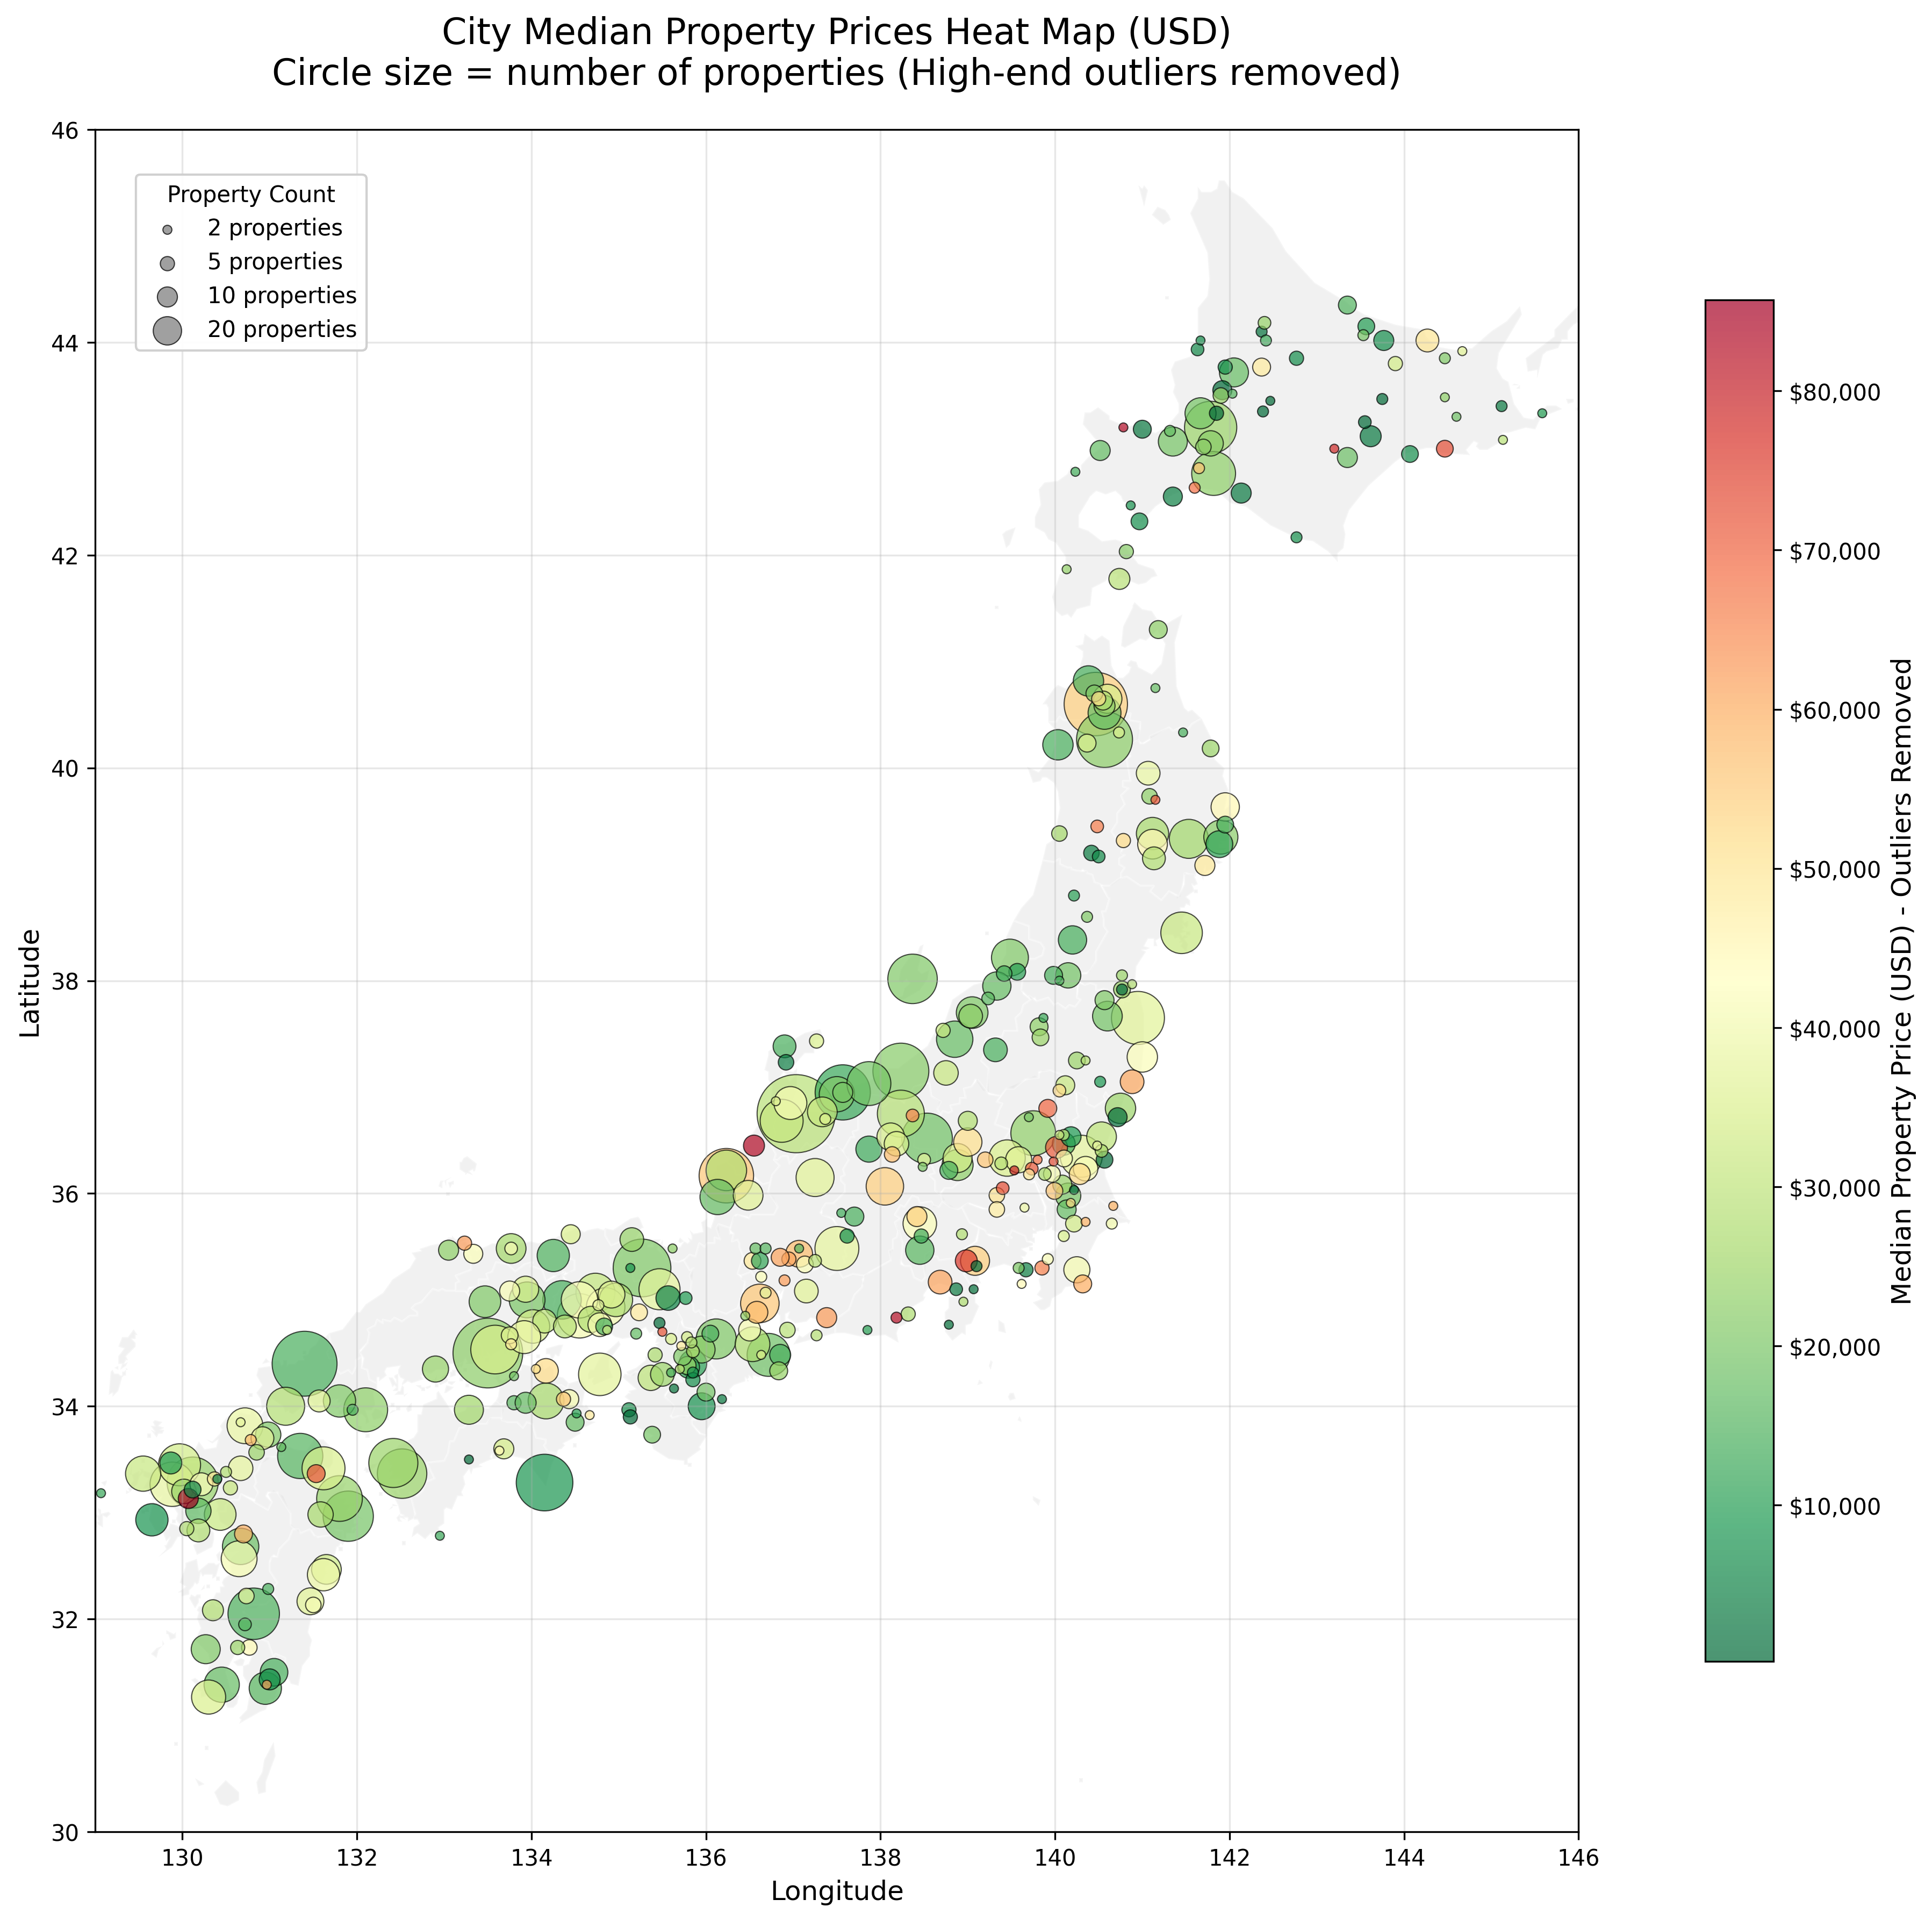
The median price analysis by location reveals distinct patterns: - Urban proximity premium: Properties closer to major metropolitan areas command higher prices - Infrastructure correlation: Areas with better transportation links show higher valuations - Regional economic factors: Local economic conditions significantly impact pricing
Extreme Value Analysis
Top 5 Cheapest Cities (by average price):
| Rank | City (Prefecture) | Average Price |
|---|---|---|
| 1 | Toyonaka (Osaka) | $158 |
| 2 | Furano (Hokkaido) | $234 |
| 3 | Kurotaki (Nara) | $4,686 |
| 4 | Takikawa (Hokkaido) | $4,731 |
| 5 | Betsukai (Hokkaido) | $4,733 |
Top 5 Cheapest Prefectures (by average price):
| Rank | Prefecture | Average Price |
|---|---|---|
| 1 | Nara | $21,078 |
| 2 | Kochi | $23,333 |
| 3 | Shimane | $26,984 |
| 4 | Hiroshima | $27,138 |
| 5 | Yamaguchi | $28,539 |
3. Property Characteristics
Property Categories
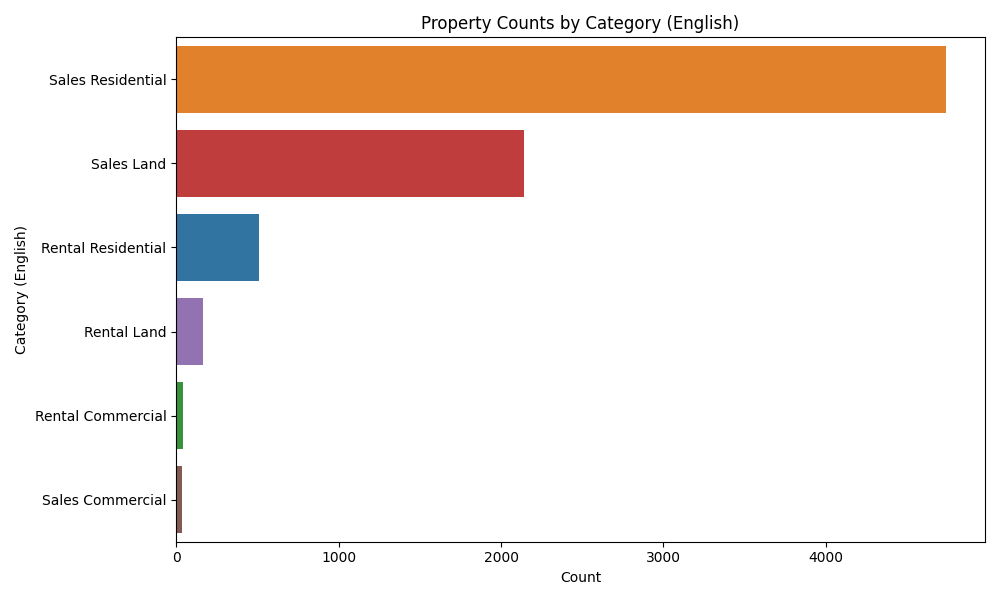
Market Composition by Property Type:
| Category | Count | Percentage | Description |
|---|---|---|---|
| Residential Sales | 4,742 | 62.0% | Houses for purchase |
| Land Sales | 2,143 | 28.0% | Land parcels for purchase |
| Residential Rental | 512 | 6.7% | Houses for rent |
| Land Rental | 166 | 2.2% | Land for rent |
| Commercial Rental | 43 | 0.6% | Commercial properties for rent |
| Commercial Sales | 38 | 0.5% | Commercial properties for sale |
Key Insights: - 90% of properties are available for purchase (売買) rather than rental - Residential dominance: 68.7% of all properties are residential (combining sales and rental) - Land opportunities: 30.2% of properties are land-only, offering development potential - Limited commercial stock: Only 1.1% are commercial properties
4. Data Quality & Market Transparency
Data Completeness Analysis
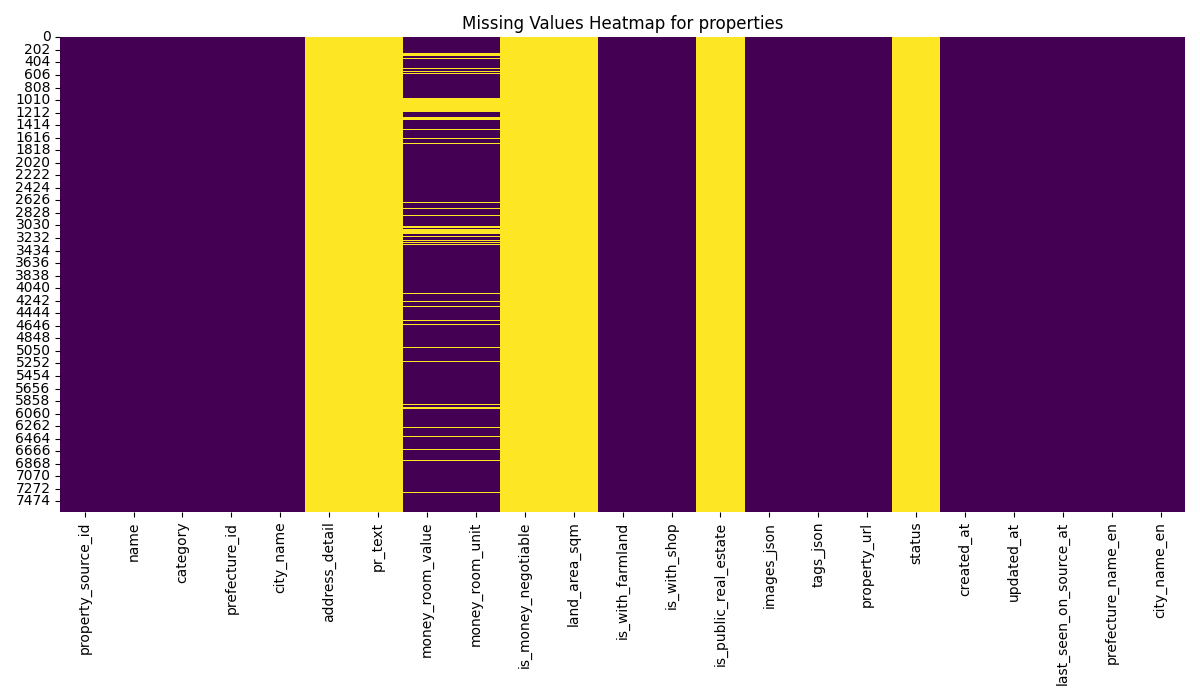
Data Quality Assessment:
| Field | Completion Rate | Missing Count |
|---|---|---|
| Basic Info (name, category, location) | 100% | 0 |
| Pricing (money_room_value) | 89.0% | 838 |
| Address Details | 0% | 7,644 |
| Property Descriptions | 0% | 7,644 |
| Land Area | 0% | 7,644 |
| Images | 100% | 0 |
| Property URLs | 100% | 0 |
Market Transparency Implications: - Core market data (location, category, pricing) is well-documented - Detailed property information is unfortunately entirely missing - Regional variations missing data may indicate different local approaches to property documentation - High-quality basic data enables reliable market analysis despite detail gaps
5. Key Findings & Market Implications
Major Trends Identified
| Trend | Key Findings |
|---|---|
| Extreme Affordability | Average price of $42,067 is 94% below Japan's national average home price (~$650,000); Median price of $27,144 makes homeownership accessible to low-income buyers; 50% of properties priced under $27,144 |
| Geographic Concentration | Top 10 prefectures contain 49.2% of all properties; Rural bias: Hokkaido, Toyama, and Iwate lead with 1,561 properties (20.4%); Urban scarcity: Tokyo has only 13 properties (0.17%) |
| Market Scale | 7,644 properties across 571 cities represent significant inventory; High turnover potential: 89% have pricing data suggesting active marketing; Diverse options: 6 property categories serve different buyer needs |
| Regional Disparities | 4,448x price variation between cheapest and most expensive locations; Prefecture averages range from $21,078 (Nara) to over $200,000; Tsunami-affected areas (Rikuzentakata, Minamisoma) show high property availability |
Market Opportunities
- Remote Work Revolution: Average prices enable complete lifestyle changes for $25,000-50,000
- Tourism Development: Properties in scenic areas (Hokkaido, Kyoto) offer hospitality business potential
- Agricultural Revival: 2,309 land and agricultural properties (30.2%) enable farming enterprises
- Community Revitalization: Concentrated city inventories (247 in Rikuzentakata) enable coordinated development
- Investment Arbitrage: Extreme price differences between regions offer profit potential
Challenges & Considerations
- Renovation Reality: Purchase prices exclude potentially substantial renovation costs
- Infrastructure Investment: Rural locations may require internet, utilities, and transportation upgrades
- Legal Navigation: Property transfers involve complex procedures, especially for foreign buyers
- Market Liquidity: 838 properties (11%) lack pricing, suggesting valuation challenges
- Data Gaps: Missing status and detail information requires on-site verification
6. Statistical Summary
Market Size & Scope
- Total Properties: 7,644
- Geographic Coverage: 571 cities, 46 prefectures (100% of Japan)
- Market Concentration: Top 10 cities contain 26.8% of properties
- Data Reliability: 89% pricing completeness enables robust analysis
Financial Profile
- Total Market Value: ~$321 million (estimated from 6,806 priced properties)
- Average Property Value: $42,067
- Median Property Value: $27,144
- Value Distribution: 50% of properties under $27,144, 25% under $12,528
- Ultra-affordable Segment: Properties available from $0.01
Geographic Distribution
- Prefecture Range: 10 (Shimane, Shiga) to 546 (Hokkaido) properties
- City Range: 1 to 247 properties per city
- Regional Leaders: Hokkaido (7.1%), Toyama (7.0%), Iwate (6.3%)
- Urban Representation: Major cities significantly underrepresented
7. Conclusion
The Akiya property market represents a unique phenomenon in global real estate, characterized by extreme affordability, vast geographic distribution, and significant opportunities for rural revitalization. With 7,644 properties averaging just $42,067, this market offers unprecedented access to homeownership and alternative lifestyles.
For Buyers: The market provides extraordinary value, with complete properties available for less than a typical car payment in developed countries. Success requires careful consideration of location, renovation needs, and long-term integration plans.
For Policymakers: The data reveals both the challenge of rural depopulation (concentrated in specific prefectures) and the opportunity for targeted revitalization efforts. Improved data standardization and streamlined transfer processes could enhance market efficiency.
For Communities: High property concentrations in specific cities (247 in Rikuzentakata, 152 in Takaoka) create opportunities for coordinated revitalization efforts and sustainable development initiatives.
The Akiya market ultimately represents Japan's demographic transition challenge transformed into a global opportunity for affordable housing, rural development, and cultural exchange.
8. Future Work
- Data Collection: Collect and analyze property data from multiple additional sources to improve the quality and completeness of insights
- Data Standardization: Develop a standardized data format for property listings to improve data quality and comparability
- Property Status Analysis: Collect and analyze property status data to understand the distribution of vacant, abandoned, active, or sold properties
- Market Segmentation: Segment the market by property type, location, and price range to identify opportunities for different buyer segments
- Regional Analysis: Conduct a more detailed analysis of the market by region to identify opportunities for different regions
- Interactive Search Portal: Develop an interactive website to allow users to search and filter properties by location, price, and other criteria
Data Sources & References
Akiya Bank: Primary source for all property listings, pricing, and location data - https://www.homes.co.jp/akiyabank/
Exchange Rate: JPY to USD conversion at 1 JPY = 0.006960 USD (market rate as of analysis date) - https://api.exchangerate-api.com/v4/latest/JPY
Technical Infrastructure: PostgreSQL database, Python statistical analysis, GeoPandas/Matplotlib visualizations, and other open source tools
Report generated from comprehensive analysis of 7,644 Akiya property listings across Japan on May 23, 2025. Exchange rate: 1 JPY = 0.006960 USD. All statistics based on homes.co.jp akiya bank data as of analysis date.