Mapping the Lightning Network: A Graph Data-Science Walkthrough
The Bitcoin Lightning Network is a payment layer built on top of Bitcoin. Where the base chain settles roughly seven transactions per second with ~10-minute confirmations, Lightning moves payments off-chain through payment channels — instant, nearly free, and settled to the chain only when a channel opens or closes. Those channels connect into a graph, and a payment can hop across several of them to reach someone you have no direct channel with.
That graph is a rich data-science object. This article walks through a complete analysis of it — topology, centrality, routing economics, and the probabilistic nature of payment success — built on a real crawl of the public mainnet: 9,990 nodes and 44,501 channels (~57% of the network), holding 5,637 BTC, captured 2026-06-03.
Everything here is reproducible. The full code — a resumable crawler, a reusable lngraph Python package, four Jupyter notebooks, a Streamlit dashboard, and a test suite — is on GitHub:
Repository: github.com/toadlyBroodle/btc-ln-datsci
The analysis is told as four notebooks, and this article follows them in order: 01 — Crawl & Topology, 02 — Centrality, 03 — Routing Efficiency, and 04 — Liquidity & Partial Observability.
What's public, and what isn't
To route payments, nodes broadcast their channels over a gossip protocol, so the topology — who connects to whom, and each channel's capacity (its total size) — is public. The balance split inside each channel is private. You can see that a channel holds 5,000,000 sat; you cannot see whether it's 5M on one side and 0 on the other, or split evenly — and it shifts with every payment. That single asymmetry is the theme of the final section, and it's what separates a graph exercise from a real Lightning analysis.
The data source
There is no "download the whole graph" endpoint. The mempool.space API only answers "what channels does this one node have?" So the crawler (notebook 01) does a breadth-first search: start from known large hubs, list each one's channels, read off the peers on the far side, queue the new ones, and repeat. It's polite (≈1.5 requests/second), backs off on rate-limit errors, caches every response, and is resumable across sessions. A second pass enriches each channel with its per-direction fee policy (base fee, fee rate, time-lock). The result is the announced graph as seen over the crawl window.
1. Topology: the shape of the network
Notebook 01 characterizes the raw shape of the graph.
It is one connected network. A payment can only reach a destination if both nodes sit in the same connected component. They do: 9,988 of the 9,990 nodes (100% to rounding) sit in a single giant component. The network is one navigable mass, not a set of islands — the precondition for routing to work at all.
Degree: a hub-and-spoke world
A node's degree is its number of channels, and the distribution is extremely uneven. The mean is 17.8 channels per node, but the maximum is 2,972 (ACINQ), with the median far below the mean. That gap is the signature of a scale-free network: the degree distribution follows a power law, which appears as a near-straight line on a log-log plot. The usual cause is preferential attachment — new nodes connect to already-popular hubs, so the rich get richer.
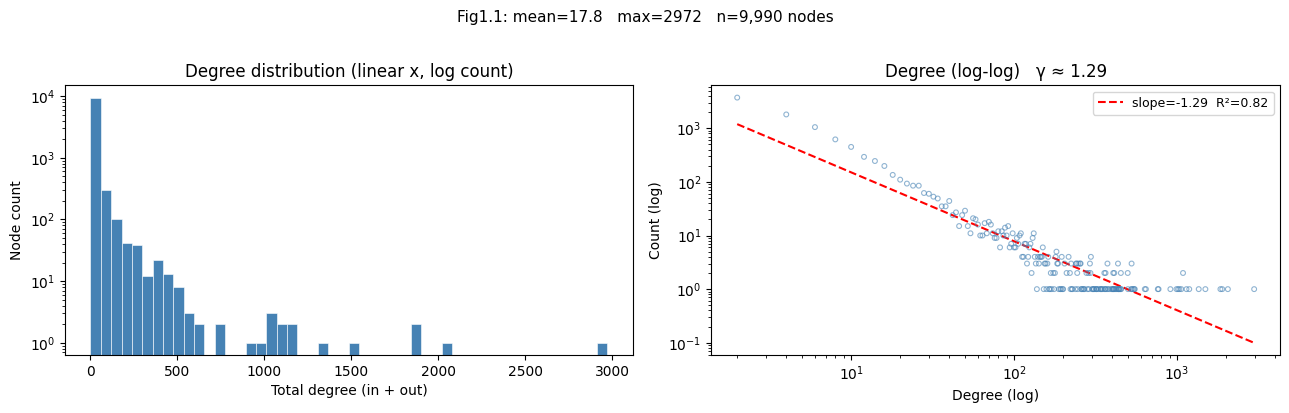
This hub structure is double-edged: it's what lets a payment cross the network in only a few hops, and it's also what concentrates routing power in a handful of operators.
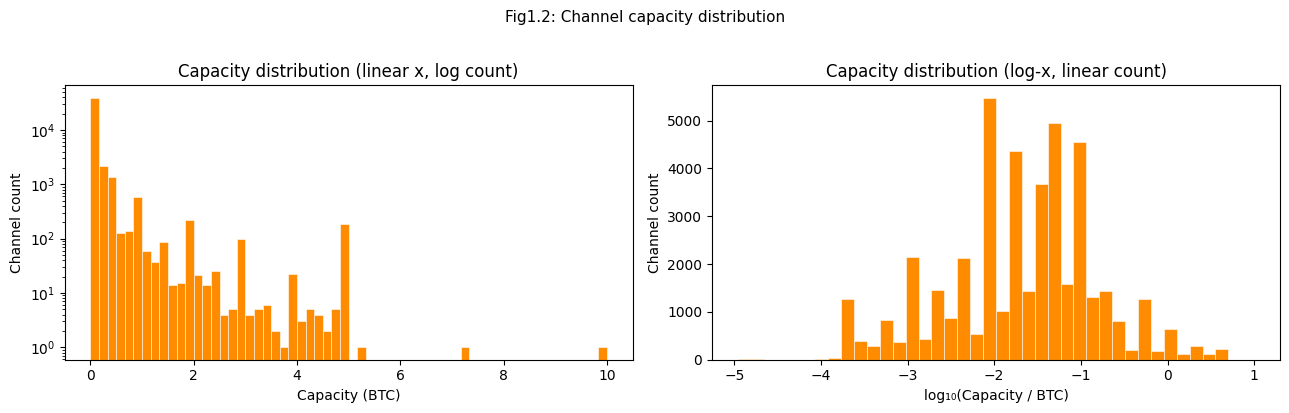
Capacity: heavy-tailed and concentrated
Capacity — the bitcoin locked in each channel — is public and just as heavy-tailed. The network holds 5,637 BTC total, with a mean channel of 0.127 BTC but a median of only 0.025 BTC (the mean sits five times above the median because a few very large channels, up to 10 BTC, drag it up). Only a log-scale histogram reveals the shape.
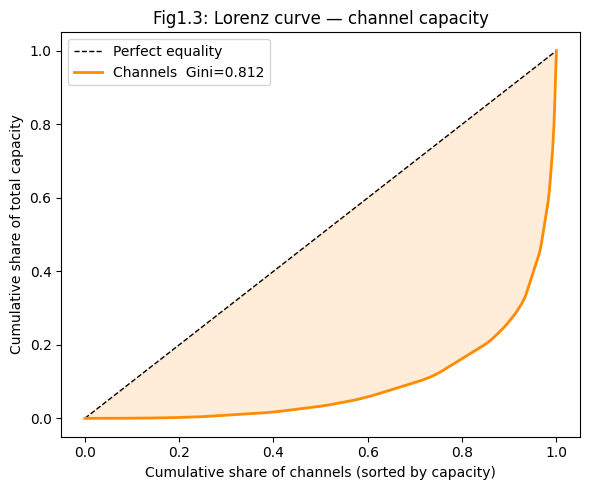
How unequal is that capital? The Gini coefficient is 0.81 — higher than the income inequality of any country. The Lorenz curve below shows how far the cumulative capacity share bows beneath the line of equality. A small set of well-funded channels carries most of the network's liquidity, which means large payments effectively depend on a few deep-pocketed hubs.
Small-world
Lightning is a small-world network — the "six degrees of separation" effect. Despite ~10,000 nodes, the average shortest path is 4.12 hops and the diameter is 12 hops; any two nodes are a handful of steps apart. Local clustering is 0.114 (moderate triangle density, concentrated among the interconnected hubs). Short paths matter directly for payments: fewer hops means lower fees and — as the last section shows — a higher chance the payment actually succeeds.
| Metric | Value |
|---|---|
| Nodes | 9,990 |
| Channels (unique) | 44,501 |
| Largest connected component | 100% |
| Mean / max degree | 17.8 / 2,972 |
| Total capacity | 5,637 BTC |
| Gini (capacity) | 0.81 |
| Avg clustering | 0.114 |
| Avg path length / diameter | 4.12 / 12 hops |
2. Centrality: which nodes matter, and for what
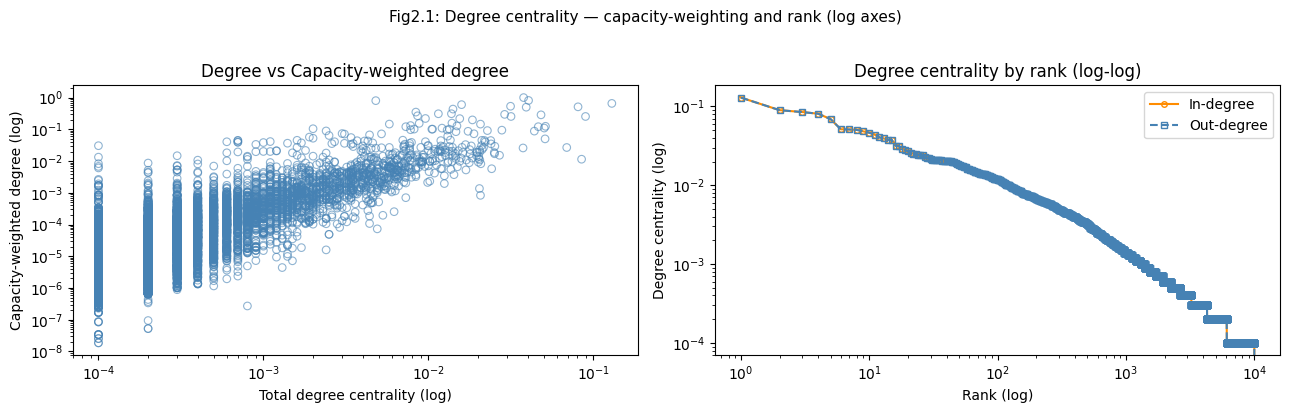
Notebook 02 asks which nodes are important — and the point is that "important" means several different things, and they disagree. It computes five measures across the graph.
Degree counts channels; capacity-weighted degree sums their sizes. The two already split: ACINQ leads on raw degree (0.130) — the most channels — but on capital the leader is bfx-lnd0 / Bitfinex (1.00, the reference maximum). That reflects two real strategies: open many modest channels for reach (ACINQ, Wallet of Satoshi), or concentrate capital into a few very large channels (the exchanges).
Closeness measures how few hops it takes to reach everyone. The top is a plateau — ACINQ (0.391) leads, but cyberdyne.sh, Sunny Sarah, and LQwD-Canada are all within a whisker, against a network mean of 0.25. Eigenvector centrality weighs who your neighbours are; ACINQ, Sunny Sarah, Wallet of Satoshi, and Kraken lead — the well-connected core that routes among itself.
Betweenness: the toll booths
Betweenness — the fraction of all shortest paths that pass through a node — is the most routing-relevant measure. A high-betweenness node sees the most traffic, captures the most forwarding fees, and would do the most damage if it failed. Strikingly, the leader is 1ML.com node ALPHA (0.18), above ACINQ — even though it has fewer channels and almost no capital. It ranks first because it bridges otherwise-distant regions; betweenness rewards position, not size.
Computing it exactly is O(V·E) — too slow at scale — so the notebook compares k-pivot sampling (NetworkX) against the exact Brandes algorithm (igraph's C core), and re-weights it by real routing cost. The plots below are on log axes; the linear "rows" in them are quantization artifacts of finite-pivot sampling, not network structure.
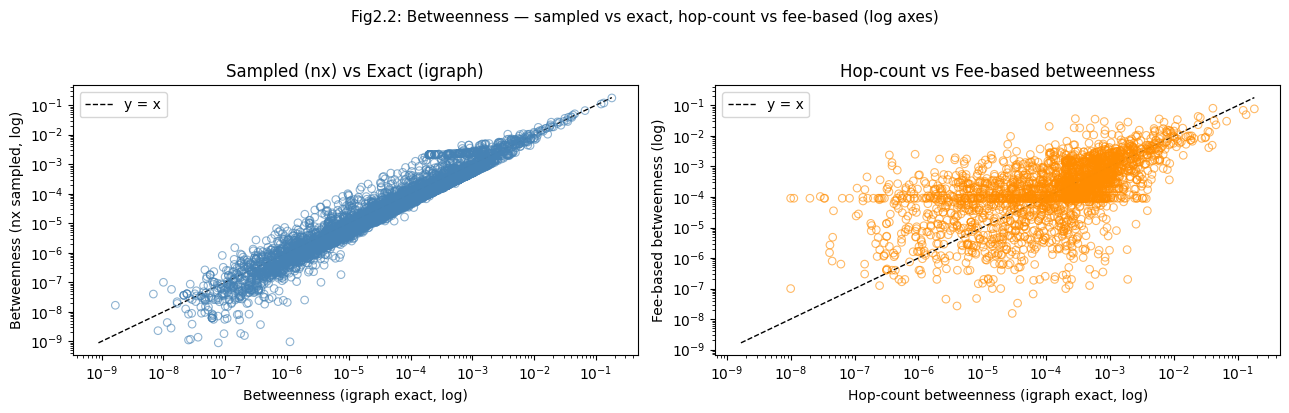
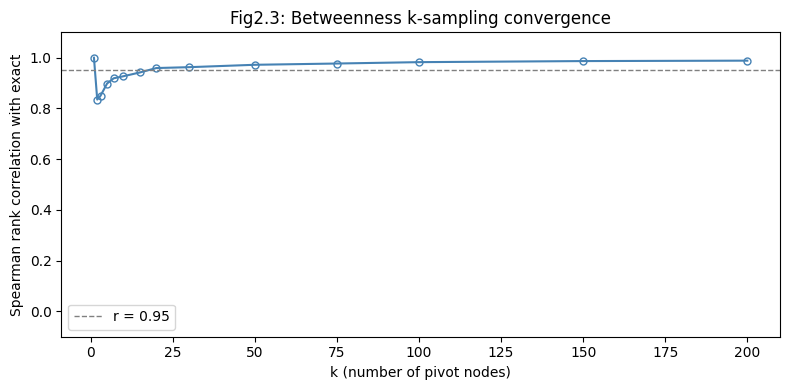
How many samples does the approximation need? Remarkably few: a single pivot (k=1) already reproduces the exact top ranking at Spearman ≥ 0.95, because the hub structure is so dominant that the same nodes sit on nearly everyone's shortest paths. Expensive global metrics become cheap to approximate.
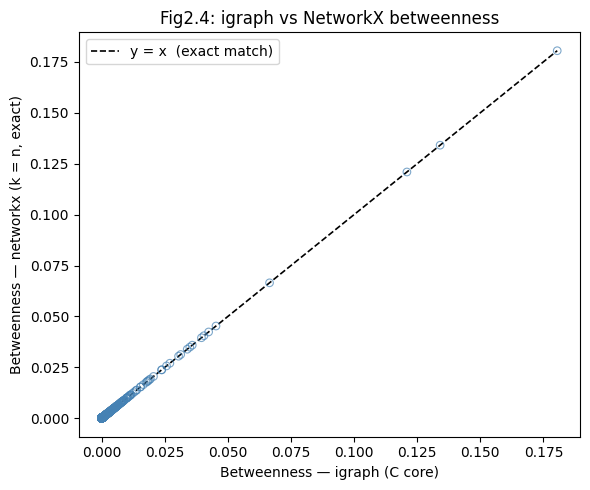
And the two implementations agree to floating-point noise — maximum difference 5.6 × 10⁻¹⁷ — which validates using the fast igraph path for the heavy work.
Re-weighting by fee reveals different leaders
Rank betweenness by real routing cost (fees + time-lock) instead of hop count, and LQwD-Canada jumps to the top (0.081), above 1ML and ACINQ — even though it's only mid-pack on plain betweenness. It lies on the most economically attractive routes, which is what real, fee-minimising payments actually use. The lesson: topology alone understates the nodes that cost-aware routing depends on.
The disagreements are the whole point: ACINQ owns connectivity, Bitfinex owns capital, 1ML owns traffic, LQwD owns cheap traffic. "Most important node" is meaningless without saying important for what.
3. Routing: what a payment costs
Notebook 03 turns to the operational question: when you send a payment, what route does it take and what does it cost? Lightning uses source routing — the sender computes the whole path in advance, and each forwarding node charges a fee and demands a time-lock (CLTV, measured in Bitcoin blocks ≈ 10 minutes each, so blocks ÷ 6 ≈ hours).
The routing analysis runs Dijkstra on a real cost function that combines the flat base fee, the proportional (ppm) fee on the amount, and a risk weight on the time-lock. The exact implementation, and the worked routing examples below, are in notebook 03.
A worked example — 100 sat from ACINQ to bfx-lnd0 — finds a 2-hop route costing 119.9 msat (0.12 sat) and 178 blocks (~30 hours) of cumulative time-lock. Lightning fees are tiny; the scarce resources are liquidity and reliability.
More hops can be cheaper — but riskier
Enumerating the k cheapest alternative routes (Yen's algorithm) is revealing. The top route is 2 hops / 119.9 msat, but a 5-hop route costs only 65.1 msat — cheaper in raw fee despite more than twice the hops, because it avoids an expensive hub's base fee. Why doesn't the router pick it? Because it piles up 270 blocks of time-lock against the short route's 178. More hops can lower your fee but raise your time-lock exposure — there's no free lunch, only a trade.
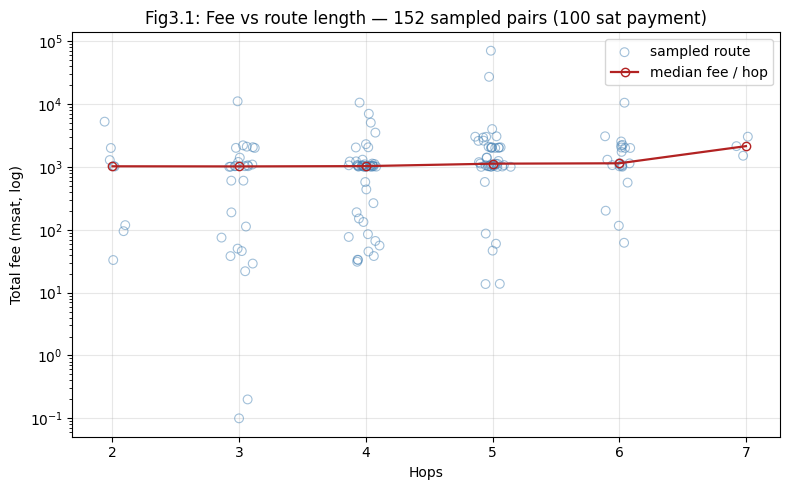
Does the network as a whole price route length? Sampling the minimum-fee route across hundreds of random node pairs shows the relationship is weak: at small payment amounts, fee is dominated by the per-hop base fee, not distance, so the median fee stays near ~1,000 msat until the longest routes, with a wide spread (a 5-hop route can undercut a 3-hop one).
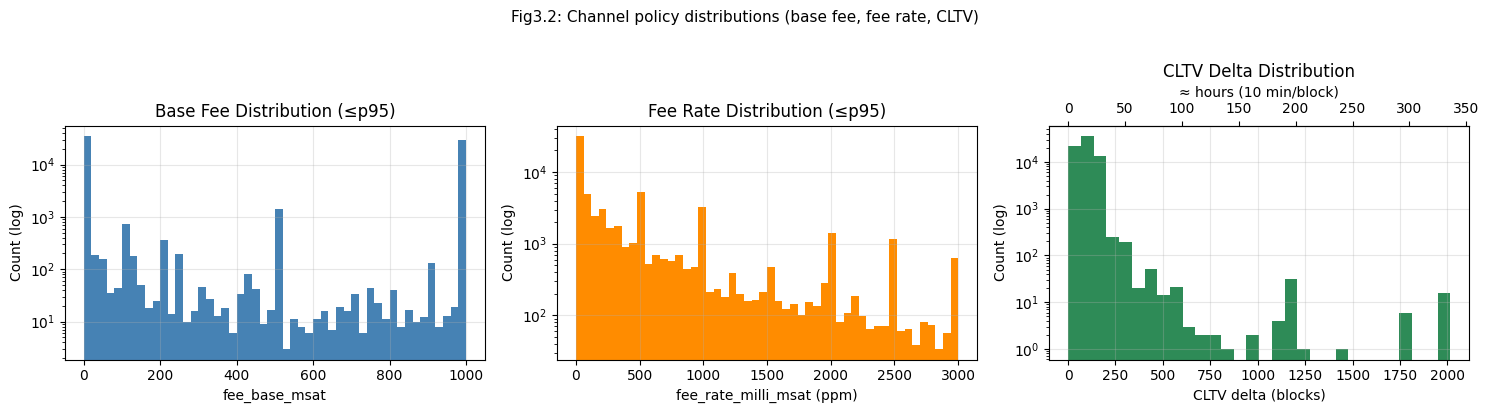
The fee landscape
Across all 70,969 enriched channel directions, the medians are modest: 100 msat base fee, 100 ppm fee rate, 80-block (~13 hour) time-lock. But the means are enormous — base fee mean ≈ 5.8 million msat — because a tail of operators set deliberately prohibitive fees (e.g. a 1,000,000-ppm rate = 100% of the amount) to switch a channel direction off without closing it. Routing never picks those, but they wreck the average. This is the textbook reason to report medians, not means, for heavy-tailed data. The histograms use log y-axes for the same reason, and the time-lock panel carries a secondary axis in hours.
4. Liquidity and partial observability
This is the part that separates a graph exercise from a real Lightning analysis (notebook 04).
A payment doesn't need capacity — it needs liquidity on the right side of each channel. And capacity is public while the balance split is not. So "will this payment go through?" has no deterministic answer from public data. The honest answer is a probability.
The model
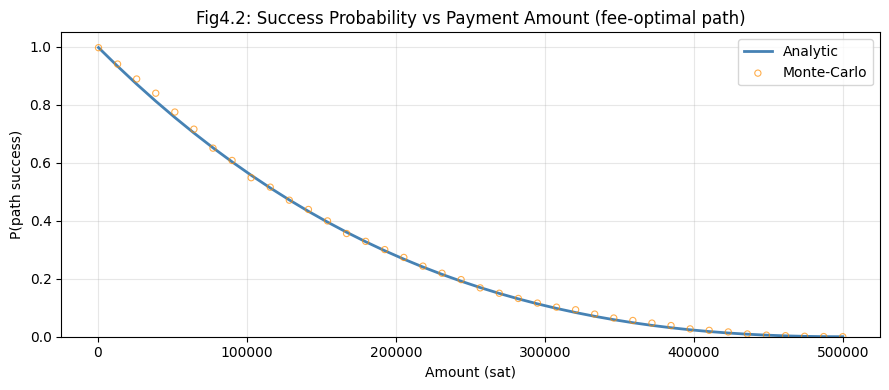
With no balance information, the least-assuming guess is a uniform prior: treat the balance as equally likely to be anywhere in [0, C]. A payment of amount A clears a channel only if the sending side holds at least A, which under the uniform prior has probability (C − A) / C — implemented, with the success-optimal router and the Monte-Carlo validation, in notebook 04.
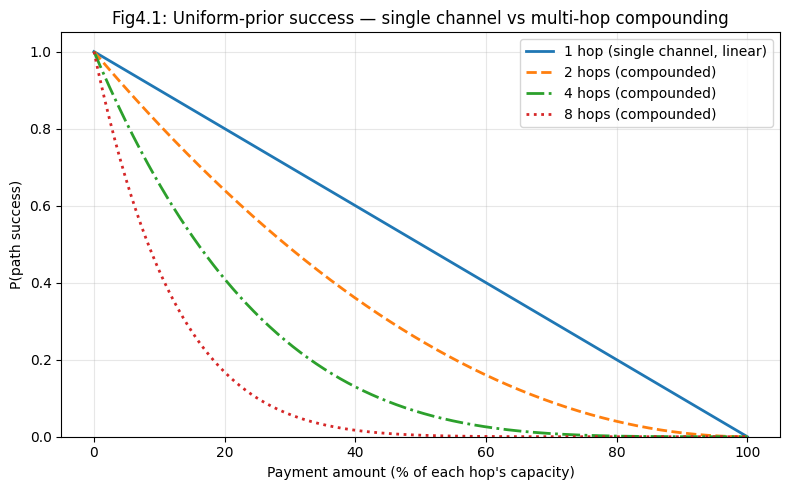
A single channel is a straight line — but a multi-hop path must clear every hop, so the path probability is the product of the per-hop probabilities, and it bends sharply downward. At 50% of capacity per hop, one hop succeeds with probability 0.50, but four hops only 0.06.
Routing for reliability, not just price
If each hop has a success probability, you can route to maximise the chance of completion instead of minimising fee — by running Dijkstra on edge weights of −log(P), which maximises the product. The contrast is stark. For a 125,000-sat payment, the fee-optimal route ran 7 hops at P = 0.48 (a coin-flip, dragged down by two small channels early in the path), while the success-optimal route was 3 hops at P = 0.84, deliberately detouring through Kraken's 136-million-sat channel where a 125k payment barely registers. It pays a little more fee for nearly double the odds of completion — exactly what production routers (LND, Core Lightning) do, treating each channel's reliability as something to be learned.
Validation, and what it costs
A Monte-Carlo simulation — drawing random balances and counting successes — confirms the analytic model: 0.475 simulated vs 0.483 analytic over 5,000 trials, pure sampling noise. The gap between routing strategies widens with payment size: at 250,000 sat the fee-optimal route's success has fallen to 0.18 while the success-optimal route still holds 0.70.
This same curve explains multi-path payments: splitting a large payment into several smaller shards routed over different paths raises completion odds, because each shard is small relative to channel capacity (higher per-hop success) and no single bottleneck has to carry the whole amount. It's how modern wallets recover from a failed large payment — a deterministic-looking failure turned into a probabilistic success.
What this is, and how to run it
The takeaway across all four notebooks is the same hub-dominated, capital-concentrated, partially-observable structure: it makes global metrics cheap to approximate, gives short reliable routes through a few well-capitalised nodes, and turns "can this payment go through?" into a probability rather than a yes/no.
The whole thing is built on real mainnet data with no synthetic fallback, packaged as a reusable lngraph library with a test suite and an interactive Streamlit dashboard. The README has a one-command quickstart (make install, make crawl, make lab) to crawl the graph and run all four notebooks yourself.
Code and notebooks: github.com/toadlyBroodle/btc-ln-datsci
- 01 — Crawl & Topology
- 02 — Centrality
- 03 — Routing Efficiency
- 04 — Liquidity & Partial Observability
Data source: mempool.space public Lightning API. Snapshot: 9,990 nodes / 44,501 channels, compiled 2026-06-03.